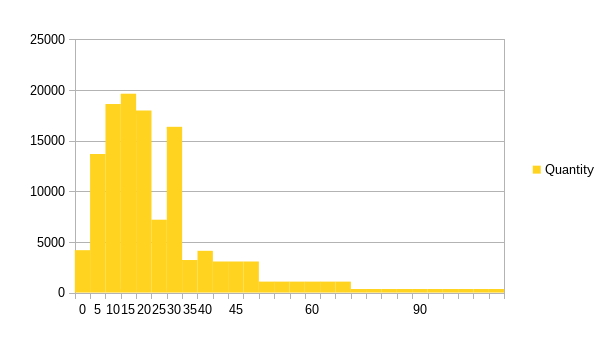
For instance:


It only appears possible to make a frequency-density histogram via workaround i.e., by repeating data rows as often as required to obtain the necessary bin width. This does require an underlying unit that all bin widths can be wholly divided by. Given the Wikipedia example this result is possible in Calc:

Source ODS here.
EDIT: Updated chart and file so that Category (X-axis) values are clearer. Related emhancement request is tdf#81530.
Yes, this seems the be the only clunky workaround so far. Hopefully this feature is added in the future: https://bugs.documentfoundation.org/show_bug.cgi?id=81530
AFAIK closest what you can get is using XY plotted line with data such as this:
1 1
2 1
2 2
3 2
3 5
5 5
I hope somebody can prove me wrong.