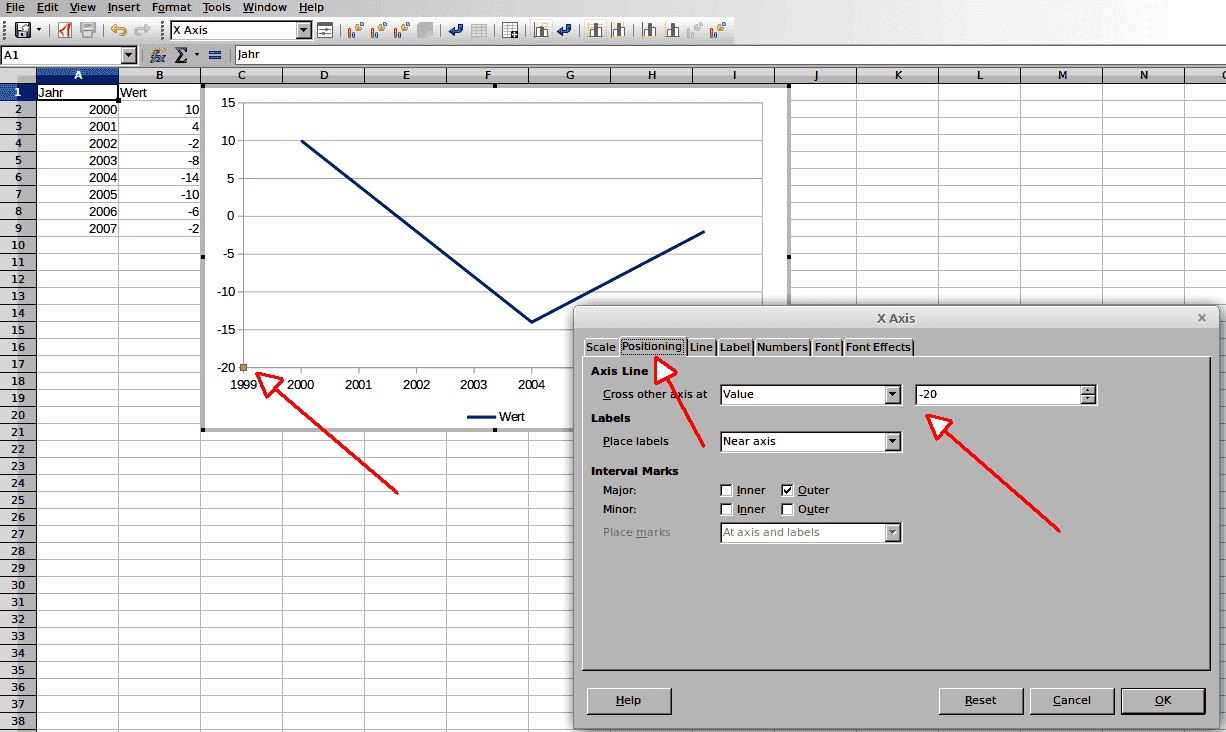
Hello, I have created the following graph and would like to have the years at the bottom of the graph. Would you tell me how to do it? I just can’t find it. Thanks in advance

Hello, I have created the following graph and would like to have the years at the bottom of the graph. Would you tell me how to do it? I just can’t find it. Thanks in advance
Vielen Dank. Du hast mir viel Zeit gespart.
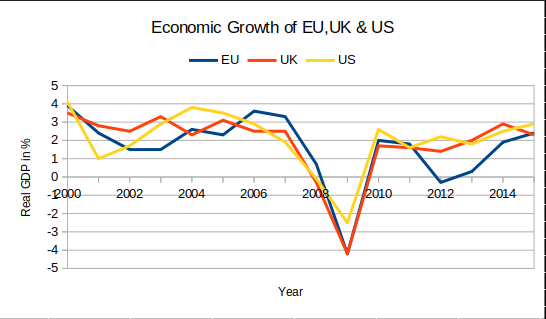
For better visualisation I would combine @anon73440385 and my solution:
Hello,
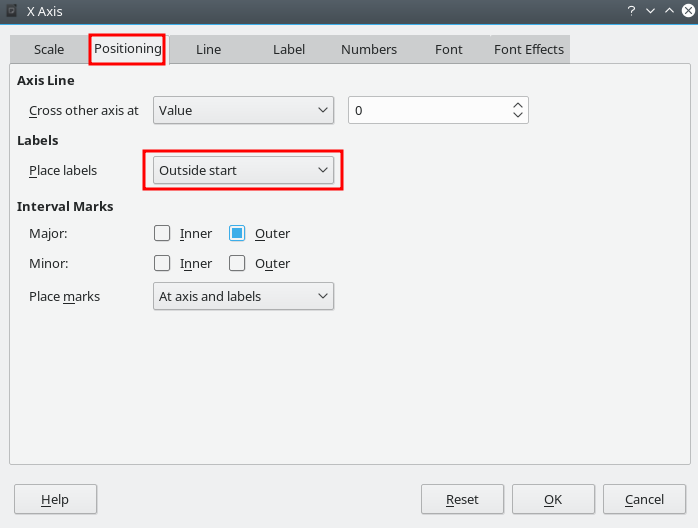
Right click -> Format Axis -> Tab: Positioning -> Option: Place labels -> Dropdown: Outside startDialog
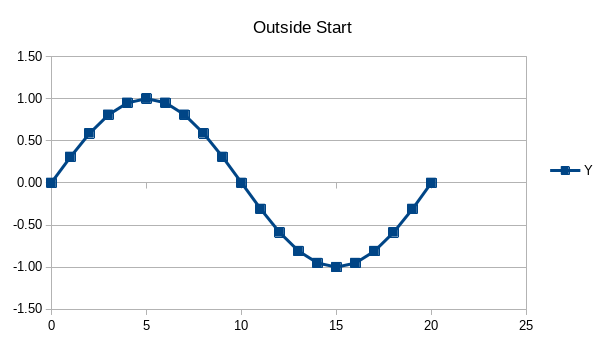
Result
Hope that helps.