Scatter Plot Data Labels don't work

Hello,

I have created a chart with 3 columns: Label, X, Y.

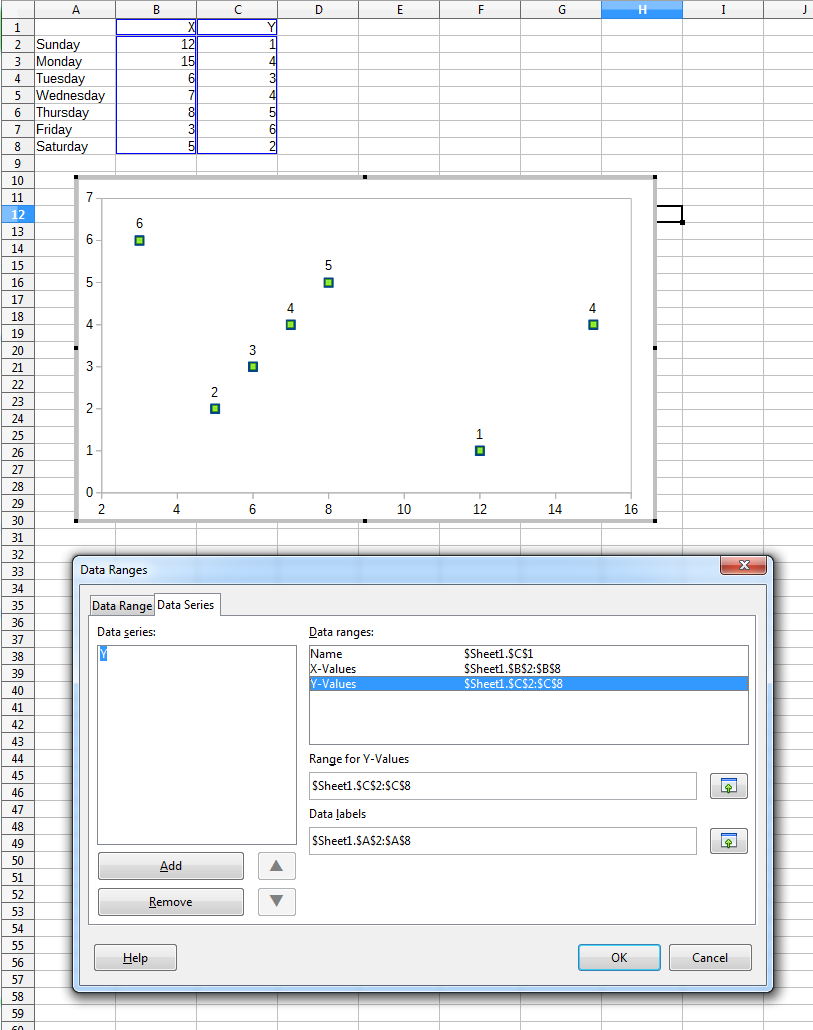
I have followed the instructions on this site on how to get each point in the plot to display the label in the first column.

No matter what I do, the label is displayed as the Y value, not the first column.

Yes, I have switched the label to be the first column, but it still displays the Y value.

Can you help me? I am using Calc 5.1.2.2.

Right-click on the data series in the chart. The context menu has the item Format Data Labels. Or in edit mode of the chart select Dataseries ... Data Labels from the drop-down list and then click on Properties icon. You get a dialog; second dialog page is Data Labels. There you have to check Show category to get values from column A as labels.

Thank you Regina, that worked!

Unfortunately, it was not possible for me to follow the suggested answer. First, clicking on Format Data Labels doesn’t do anything by itself. And the dialog that shows when clicking it just shows the visual formatting such as Borders, Font, etc. Second, it is not clear to me what “edit mode” is. How do I enter it?