I have a chart made in calc. that I wish the lines and squares were smaller. Is there a way to adjust them?

I have a chart made in calc. that I wish the lines and squares were smaller. Is there a way to adjust them?
Hello,
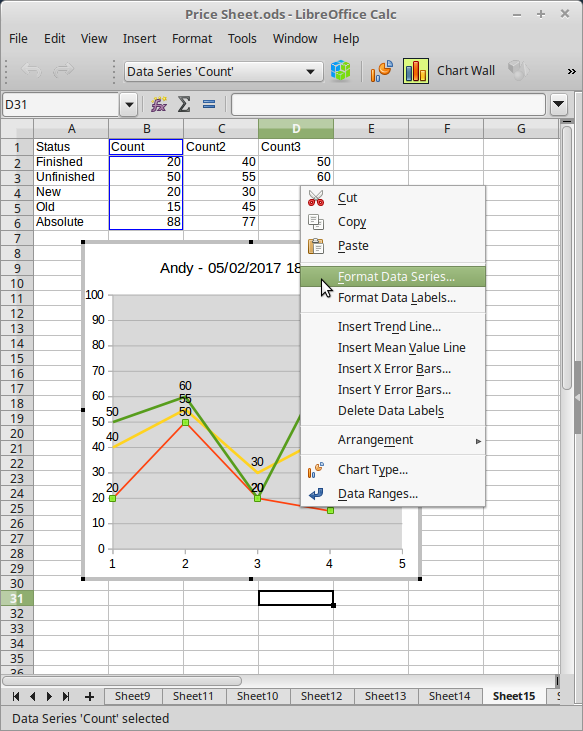
First select the chart with a left mouse click. Next select the line with a left mouse click. Then right mouse click the line and select Format Data Series.... The options you want are on the Line tab.
Edit:
If you have successfully select the line & right click you should see:
Then, selecting Format Data Series... you will see this dialog:
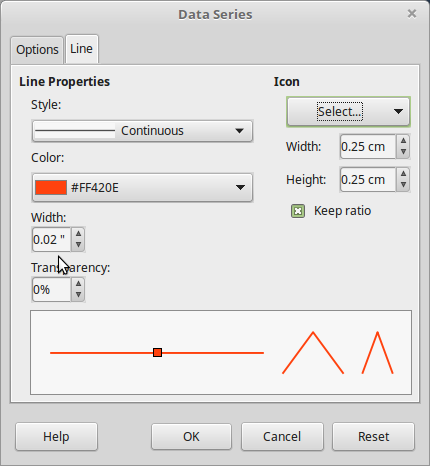
The line width is under the color selection and the icon size is on the top right.
I tried your instructions, but I failed to find “Format Data Series…” There is a menu with Line in it, but none of the adjustments that I made to the line that I selected were implemented. I selected the red line and the color was listed as blue. I tried dashed line and it didn’t change.
I remember this from earlier this year that nothing worked. I tried to get help then, but now realize that my post wasn’t done correctly by me and it was not posted.
@joeh6966 Once the chart is selected, you may have to double click in the chart area before actually selecting the line, but being able to select the line itself is the key.
Thanks; the double-click hint is what worked.
Should there be a few corrections to calc to exclude the Line menu from the calc program because it doesn’t do anything anyway, at least for me?
No, I don’t believe so. The selection places a line of type & color chosen around the outermost frame of the chart. At least that is what shows on the test I just did.
how to create new width default for new template. Not one by one in new chart.
This forum is designed to answer the question asked in the original post. If you have a new question, ask as a NEW question and do not post as an answer. Although both about lines in a chart, it is a completely different process.