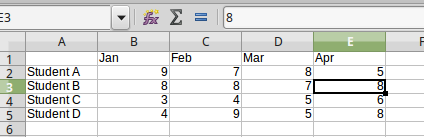
I’ve been struggling with this issue for some time. I need to create several evaluations and I’d like to use my calc spreadsheet data to do it.
I was able to input the data into a text using Field Forms, but I need to add personalized graphs (charts) as well, and I haven’t been able to find out how to use directly the data from the spreadsheet to create the charts.
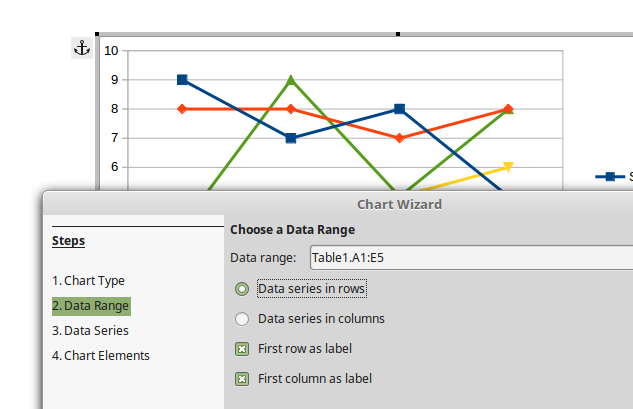
So far, I’ve been able to generate all the reports, and then edit each graph’s data table by hand. Is there a way to link the data from the spreadsheet directly, and generate the graphs (carts) automatically?
Is there a way to do it?
Can someone help me, please?
Thank you for your answers!
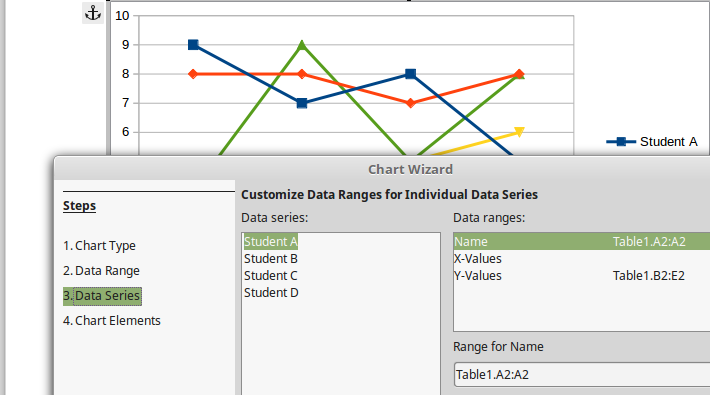
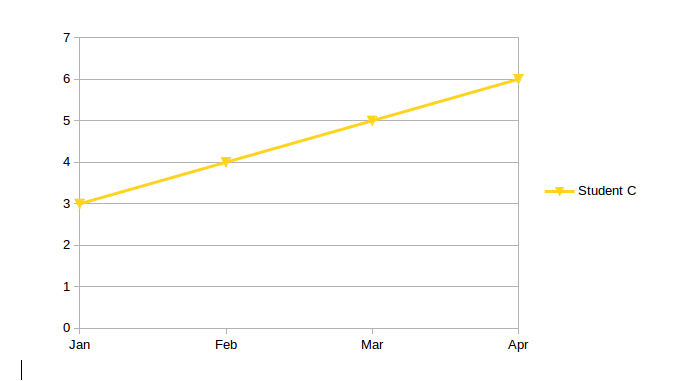
I’ll have a look at the options you’ve mentioned. Nevertheless, I don’t need to create a chart, but many charts, each corresponding to one line of data from the spreadsheet. I’m looking for something that works similar to form fields. For example, I need to generate 10 different pages using data from a spreadsheet of 11 rows (1 label + 10 rows of data). I’m able to do that in plain text, but not with charts.
I’m sorry, I guess, I haven’t explained it well enough before.
Can this be done?