Gantt chart labeling

It’s my first time in this forum, so i didn’t know what to expect.
So, I just waited for responses to see what you need:) Pitty I can’t subscribe to these questions.

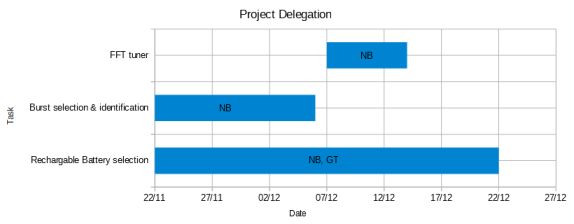
I have created a simple Gantt chart in libreoffice using the advice in the web.
You can download the sample of what I’m talking about, Mobisol.ods, from:

The advice I got from the web is the same for all spreadsheet calcs, from openoffice, to excell and to libreoffice:
Basically I start with a stacked bar graph, where I set the fill of the bottom stack to “none”. I also have to set the y-axis to date format.

I’m not asking for anything complicated like hierarchical plots. I just want to assign ownership to each task (bar). I was thinking of 2 possible ways, feel free to suggest better ones:

  1. Label each bar (data point) with its owner.
  2. Use a secondary x-axis where categories (owners) are different from primary x-axis

TIA,
Nikos

Are you expecting those who are able to help with LibreOffice usage to be necessarily experts in special topics, like Gantt charts, or mind readers? What was the “advise in the web”, which address at least to see the end result? Or better, a sketch of desired end result, and your sample file put somewhere on a share, and a link to them here.

The question is better now after your edits. For more advice on questions, see Guidelines for asking - #4 by jimk.

After messing with this for a couple of hours, the only way I could find to add owner labels is to duplicate the chart. The duplicated chart is transparent except for the data labels, which are categories coming from the owner column.

This has the disadvantage that if one of the charts is edited, then the other chart must be edited as well. However, both charts will automatically adjust when data values are changed.

The result: Mobisol_modified.ods

result with labels

Thanks Jim,

You certainly put a lot of time into it, which coming from an LO guru, means there is no straight way to do it. It has the added disadvantage that if you move around the graph to check on the data, you loose the labels:(
A similar approach would be to save the graph as an image and edit the labels directly into it.
I will have to consider these options, but it seems to me I need to look for a dedicated Gantt software :frowning:

I consider yours as the right answer, even if negative.