Hi all,
Is there any references/example of inserting chart using python (through pyuno) for Libreoffice writer ?

Hi all,
Is there any references/example of inserting chart using python (through pyuno) for Libreoffice writer ?
Hello,
Your question had me revisit converting my Base charts to complete some of the conversion to Python. Since Base Forms are basically Writer documents, I thought I would produce a sample for you. What started out to be a small project has taken up more than my entire day! First, here is the code I present:
#!/usr/bin/env
import uno
import sys
import os
import time
from array import array
from com.sun.star.awt import Point
from com.sun.star.awt import Size
from com.sun.star.text.TextContentAnchorType import AT_PAGE
from com.sun.star.text.VertOrientation import NONE
from com.sun.star.text.HoriOrientation import NONE

def create_chart(*args):
    doc = XSCRIPTCONTEXT.getDocument()
    textFrame = doc.createInstance( "com.sun.star.text.TextFrame" )
    text = doc.Text
    textFrame.Width = 11000
    textFrame.Height = 7500
    textFrame.AnchorType = AT_PAGE
    textFrame.RelativeWidthRelation = 1
    textFrame.RelativeWidth = 100
    textFrame.SizeType = 1
    textFrame.VertOrient = NONE
    textFrame.HoriOrient = NONE
    cursor = text.createTextCursor()
    text.insertTextContent(doc.Text.End,textFrame,0)
    textFrame.Text.String = chr(13)
    textObject = doc.createInstance( "com.sun.star.text.TextEmbeddedObject" )
    textObject.setPropertyValue("CLSID","12dcae26-281f-416f-a234-c3086127382e")
    textObject.Name = "ChartID"
    textFrame.getText().insertTextContent(textFrame.Text.End, textObject, False)
    docChart = textObject.EmbeddedObject.Component
    docChart.Diagram = docChart.createInstance("com.sun.star.chart.BarDiagram")
#problem area in follow:
    rowDesc = ["a","b","c","d","e","f","g"]
    docChart.Data.setRowDescriptions(rowDesc)
    colDesc = ["First", "Second"]
    colDesc[0] = "Third"
    colDesc[1] = "Fourth"
    docChart.Data.setColumnDescriptions(tuple(colDesc))
    myData = [[100,150],[200,50],[300,270],[400,63],[500,82],[600,645]]
    docChart.Data.Data = tuple(myData)
#problem area above
    chartTitle = docChart.getTitle()
    chartTitle.String = "Sample Python Chart"
    docChart.Diagram.getAxis(0).getAxisTitle().String = "Some Stuff Here"
    docChart.Diagram.getAxis(1).getAxisTitle().String = "Maybe Distance"
    docChart.HasLegend = 1
    myDoc = XSCRIPTCONTEXT.getDocument()
    embeddedObjects = doc.getEmbeddedObjects()
    chartObject = embeddedObjects.getByName("ChartID")
    chartSize = Size(15000,6500)
    chartObject.setSize(chartSize)

g_exportedScripts = create_chart,
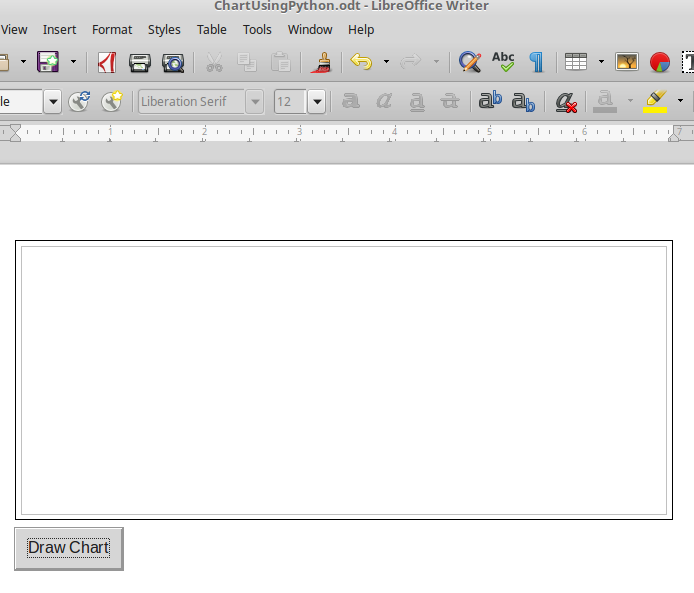
This code works without a problem in a Base Form. However, there are problems in a Writer document. The code will finally work, but when first executed it starts out as:
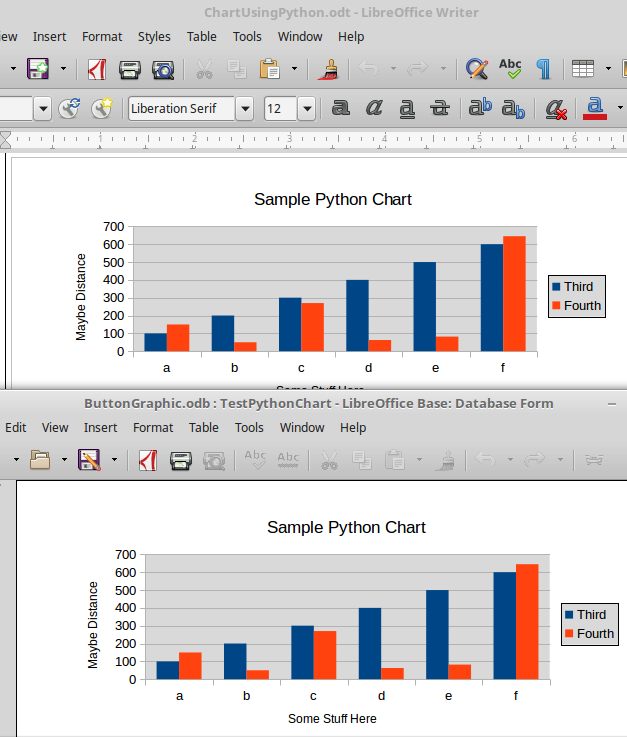
Now I like to use charts inside frames because it is easier to manipulate, so that is what is seen. When the inside of the frame is clicked on (where the chart actually is) Writer crashes. When recovered through the normal recovery process the Chart appears complete. Here is the chart in both Base & Writer:
The frame on the Base chart is harder to see since it goes to the edge of the screen. Both were done using the same code. Base appeared instantly & writer crashes but can recover to successful display. The problem area is indicated in the code; The Row/Column descriptions & the actual data. Even if only one (any one) is present - crash. Been trying all day with searches & not finding anything. This may be why you only find Python code for Calc. I actually never found any for Base. Devised this over a long period.
You can find my post here regarding charts in Base forms. It contains samples and the basic code in the samples. The code actually has many optional settings for charts and the code for different chart types.
Well, at least this may give you a starting point.
As a further note, just tried creating chart in Writer using code in Basic. Same results. Got to be some problem but lost as to what it is.
I was not aware that this could be done outside of Calc (and I mistakenly overlooked the writer tag in the question). I wonder if a chart can use a Base table as the data source?
@jimk I don’t see any reason why not. I do this all the time in Base. You can see this in the post I mentioned near the end of my answer. There I use Queries to retrieve data for display within the charts. The samples include a number of variations.
Note: I should clarify '…as the data source…". The data is obtained from the tables thru SQL and must be re-done if table data changes. There is no ‘Live’ connection to the tables.
To avoid the crash in Writer, append the following code.
ctx = XSCRIPTCONTEXT.getComponentContext()
smgr = ctx.ServiceManager
frame = doc.getCurrentController().getFrame()
dispatcher = smgr.createInstanceWithContext(
    "com.sun.star.frame.DispatchHelper", ctx)
dispatcher.executeDispatch(frame, ".uno:Save", "", 0, ())
dispatcher.executeDispatch(frame, ".uno:Reload", "", 0, ())Thanks. Now works as expected. Thought there was a solution but because Base worked had gone in wrong direction for too many hours.
Apparently, these charts are different from those in Calc in that they use an internal data table rather than an external data source. So the data must either be entered manually in the chart table or come from a macro, such as the query in your example.
Not completely certain of that. For example, in both Base and Writer you can have Text Tables Which an inserted chart can be based upon. I believe this is also possible with this code but haven’t tried yet. There are some other possibilities I have thought of but again time and necessity get in the way. Just not a priority yet.
One more idea regarding the crash: Perhaps when resizing, it would help to call Interface XEmbeddedObjectSupplier2.
Thanks for this last link. Although your fix worked, I wasn’t thrilled with it. I have now replaced your fix with:
extendedChartControl = chartObject.getExtendedControlOverEmbeddedObject()
extendedChartControl.changeState(4)
Still not the best but works. So much more can be done. Searching API becomes tiresome.
@jimk Got one more for you on this subject. Your comment about using external data source. See my answer here. I try to look at this every once in a while. Gets sheet in doc but haven’t gotten actual live links working. Actually its’ what led me to charts in Base. Had to laugh when I looked at it just now cause I used extendedControl there. This may revive my interest to get it working.
Thank you, it’s work like a charm.
@jimk Unfortunately, there is no means to attach external data to a chart in Writer. However, since you can have a linked sheet in writer, this can be used as the data source. Getting data to the chart must be done through a macro using the embedded sheet to create a range. Then using the embedded chart object, the range is input via the attachData() method.
@Ratslinger: That sounds like a good setup. Usage of attachData() is shown in the example at Data Access - Apache OpenOffice Wiki. By the way, it seems we may have exceeded the number of comments that this site displays, because they don’t show up when I go to Inserting Chart using pyuno.
@jimk As for comments, if you look at your last link you will see at end of comments see more comments. I’ve been through long lists of comments here before. As for usage, already have working document with embedded linked sheet (done through macro - solved that too) and a chart getting the data from that sheet. What I haven’t gotten to yet is attaching a listener to chart to reflect changes detected in embedded sheet when it changes. A long way in a couple of days.
Well, I usually read things carefully, but that see more comments link tricked me. It’s exactly the same font color and icon as the add a comment link that was there before more comments were added. Anyway, thanks for pointing that out. And it’s interesting to hear about the progress you’re making with the chart.
Already added a change listener & now when I change the original Calc doc, after the defined period the Embedded chart in the Writer doc updates & triggers the change event which updates the actual chart in the Writer doc. Keep in mind, currently doing this in Basic, as that’s where the OLE project started but converting to Python should be no big deal. Needs some cleaning up before I can figure a way to produce demo - maybe in a new question I produce. Not bad, Writer chart based on Calc doc.
There is a python example at Python-Calc - Apache OpenOffice Wiki.
However, it may be better to start with Andrew Pitonyak’s macro document section 6.27. Add a chart and translate it from Basic to Python.
 (upper left area of answer).