
It used to be possible in previous versions without having to destroy the chart and start from scratch again.
I got “set first column” and “set first row” selected. I want A2:A400 as the X axis. not W7:W385
It seems the answer is to use Excel to fix that.
Perfectly possible.
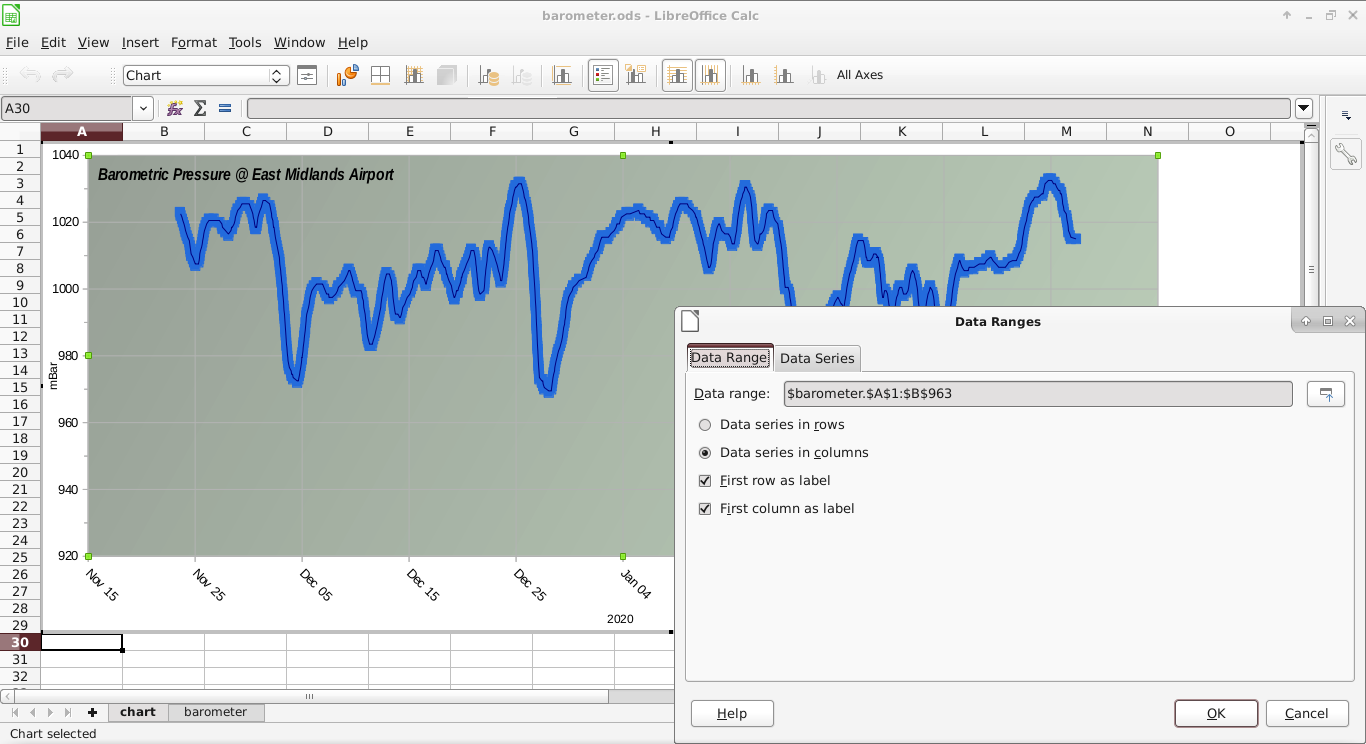
The attached ODS (Calc) file has data for a Chart in the “barometer” tab & the actual chart in the “chart” tab. Take the following steps to get the screen as shown in the screenshot above:
- Switch to ‘chart’ tab
- Click mouse 3 times in short succession on the Chart
(the screen switches to that shown above) - Click on “Data Ranges” icon
(top-line, near middle of line) - Click in ‘Data range’ line of Dialog & change value
- Press OK when complete
I do this all the time to update after adding new values within the ‘barometer’ tab.
Version: 6.1.5.2
Build ID: 1:6.1.5-3+deb10u6
Devuan 3 (Linux)