Hello all.
I have taken one Statistics Course about 60 years ago, in my 20s. For all practical purposes, I am starting from scratch.
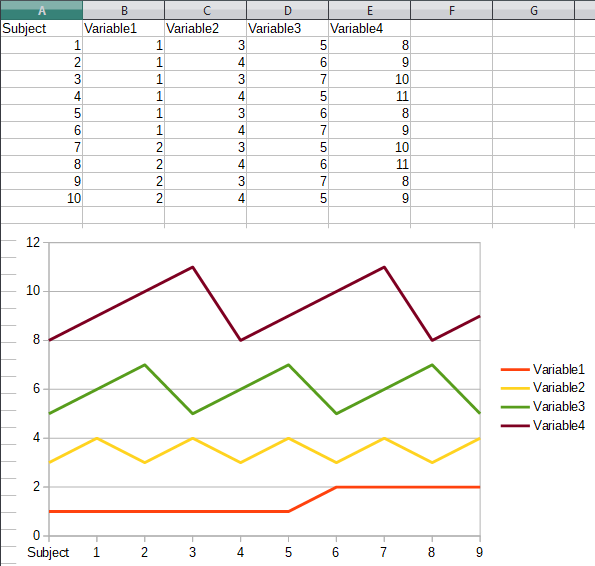
I need to make a chart of the following data type.
10 subjects.
Two tests; before baseline, and after; results of administration.
Both tests are for 4 variables for each subject.
Please tell me the ideal chart type for this study.
Recommendations for the most informative data analysis will also be appreciated.
Thank you for your time, attention, and expertise.
james-osbourne
This is quite an open-ended question. For more helpful answers, you will need to narrow down the requirements. See if you can come up with an example.
Thank you very much.
I may not have expressed the experiment correctly.
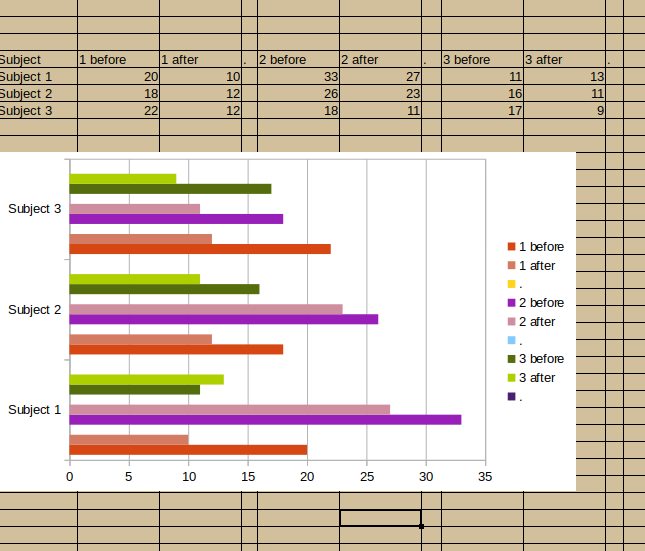
The study has changed slightly. The number of variables has been reduced to 3 (three). There are 10 subjects, three variables, a baseline test for each of the 10, administration of a substance, and a second test for the three variable. The researcher prefers a simple bar chart. He does not want to confuse readers with a too much statistical detail.
An initial test for the amount of three chemicals found in the body. Then\ the test substance is administered, and the levels of the three chemicals are tested again.