[Calc] displaying exact data value on Y-axis of bar graph

Hello,

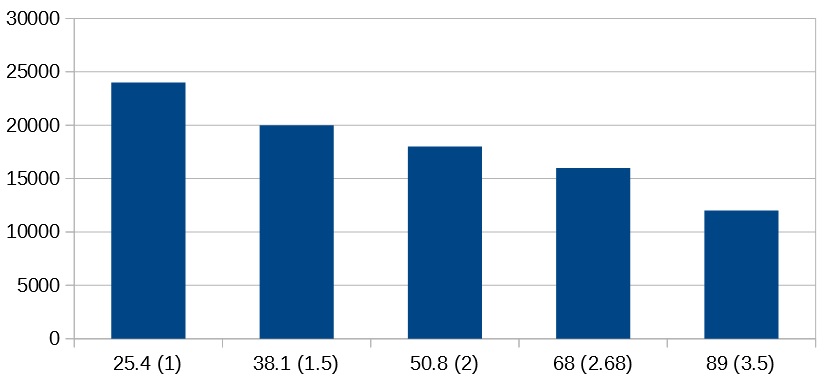
I’m new to LibreOffice and Calc. I have a data range I’ve plotted in a bar graph (see embedded image below), and I would like to display the exact values of the data on the Y-axis, instead of something “proportional” (for example, one of my values is 24319, and I would prefer that that exact value were shown at left, instead of just a bar near the 25000 major-axis line mark of the Y-axis).

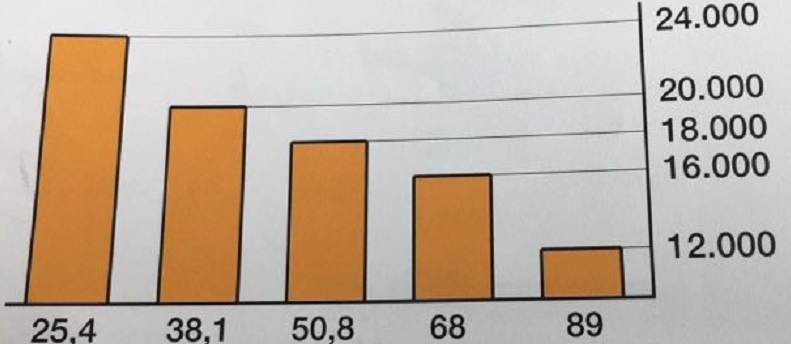
My goal is to display something similar to the chart below. Hopefully this is helpful.

Thanks in advance for your help.

The axis uses intervals, which can’t be changed to reflect individual data points. But you can activate Data Labels. Double click the chart, then click on a column (you should see green marker points on each column), then right click to get the context menu and choose Insert Data Labels (or use menu Insert → Data Labels). You then have the data values displayed as labels on top of each column. If you click on such data label you can apply formatting, context menu Format Data Labels or menu Format → Format Selection.

erAck, thanks for the help. I’ve gotten something more like what I’m looking for. Looking through the Data Labels formatting menu, it looks like there is no way to manually position the data labels, except for the options in the Placement drop-down menu (Outside, Center, Near origin, etc.). Do you know of any ways to manually control the position of the Data Labels within the Chart?