
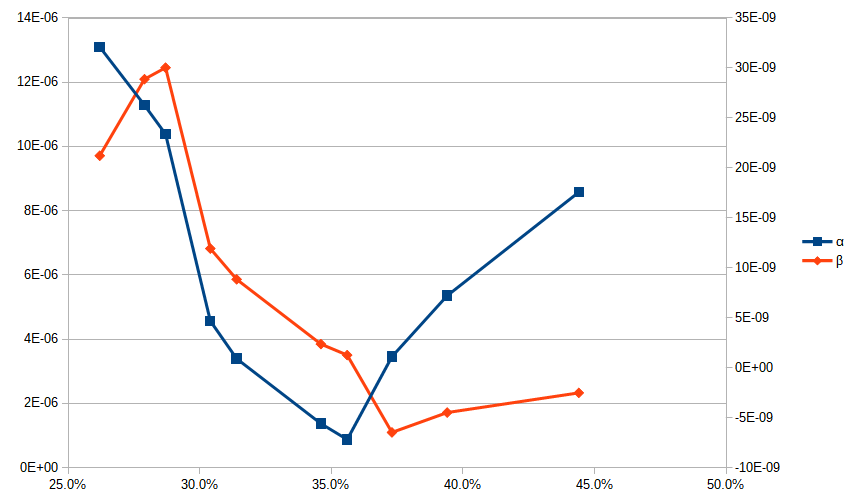
I have created this chart in Calc with two curves that align to different Y axes. Although they are wildly differing scales, I would like the zeros to lign up, to show visually that the red line (secondary Y axis) plunges into the negative whereas the blue line (primary Y axis) is always positve.
I have the same issue. I am surprised its just us!
If your chart uses the X-Y (scatter) style, you can adjust the scale (and other things too) of any axis. Right-click on an axis, choose Format Axis, choose the Scale tab, un-check all the “automatic” settings and enter your own settings.
Also, when formatting an axis, click on the Numbers tab and be sure that the Source Fomat box is un-checked. Then you will have full control over how the numbers appear on the axes, regardless of how they appear in the spreadsheet itself (number of decimal places, etc).
Having said all that, I have no experience with axes using exponential number formats, so you might have to experiment a bit to make it work.
If this answer helped, please click the check mark at left above. Otherwise, you could add a comment with further information about the problem.
Thanks for your suggestions. Unfortunately I had already tried them without success.