
Are there any chart types that would be appropriate for categories only on the Y-axis as well as the X-axis? Example: animals on one axis and colors on the other axis.
And what should be the benefit (of information) of such a 2-dimensional chart other than: There are “black cats”, “white horses” and “grey mice”? Help me with the intention of such a chart …
It would clearly show which animals are black, which are white, which are green, etc. Do you need another example? Maybe a table would make more sense. I am just trying to understand charts.
I fully agree - this is what tables are for and not charts.
Yes, of course you can create a chart. But you have to check if it makes sense to you. Here’s an example:
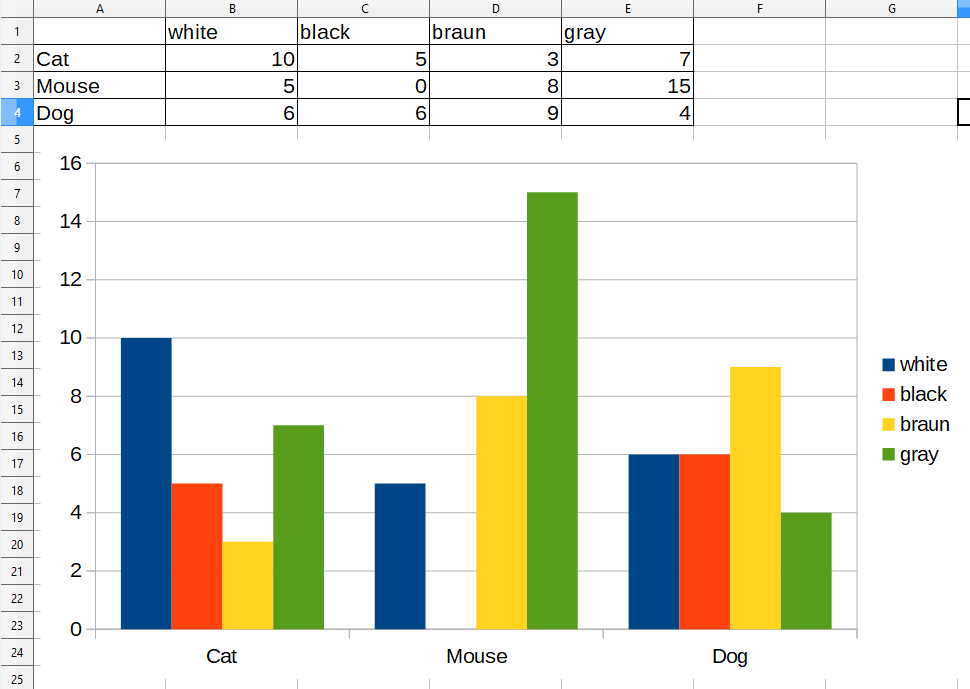
This is not what OP was talking about - this is numbers on Y-axis and not a category. And according to OPs comment, the expected info from such a categories-only chart would be only animals being black, other animals being grey, some both and without any numbers. The above chart is mathematically a 2-dimensional presentation of 3-dimensional data - X=animals, Y=color, and Z=their respective number in the sample.
I realize that my question may seem a bit off the wall. I asked the question to clarify my understanding of charts and both of your responses have helped me understand better. Thank you for taking my question seriously.