
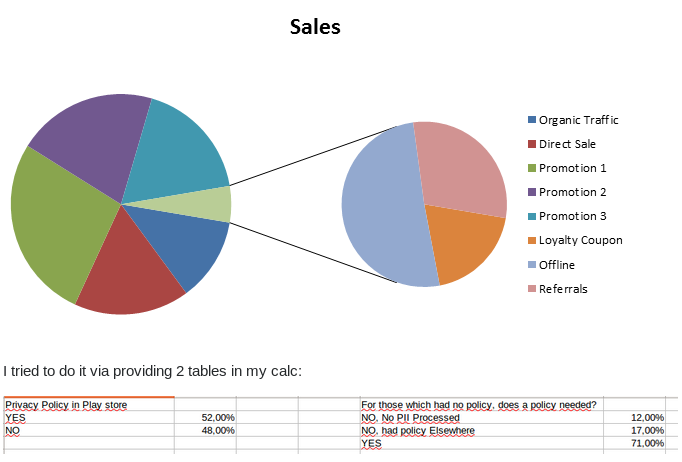
I want something like this:
Is there a way?
The poor method that comes to mind is to create two separate charts and add the lines in manually, but if I were to change the size of the sector in the larger chart connected to the smaller chart (light green section) the lines would be misplaced. I want something similar to the picture, just some way of adding additional proportionality info to a sector.