
I know it is possible to add plain text to a chart in Calc (by inserting a text box or a rectangle containing text), but is it possible to add a rectangle containing a reference to a spreadsheet cell?
For example, instead of drawing a rectangle in a chart area and then adding plain text to that rectangle, what I would like to do is draw a rectangle in the chart area and then add a reference to a spreadsheet cell in that rectangle (e.g. =$Sheet1.A6). Then, every time that referenced cell changes its value, the chart will show that new value.
I have a number of spreadsheet files that use the same chart layout but with different data, so this feature would save me having to type in a different absolute value into every separate spreadsheet chart.
I can do this quite easily in Excel charts, but can’t find a way to do it in Calc. (Maybe LibreOffice doesn’t support that feature?).
Many thanks for any advice on this one.
Geoff_B
Hello,
you could do the following:
- Assure you are in Design Mode
Tools -> Forms -> Design Mode(Update) - Insert a text form control
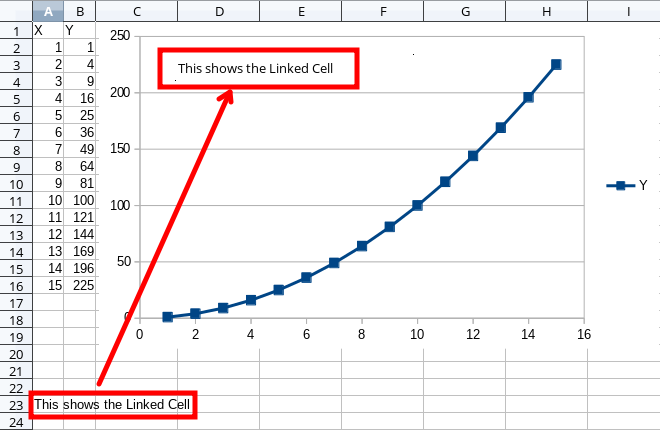
Insert -> Form Control -> Text Box - Define the
Linked Cellin the Control Properties Tab:Data(A23 in the example below) - Define in Tab:
Generalat least option Border to not be 3D (looks a bit strange when doing the following) - Place the Control (Text Box) to your chart
- Select the control and keep key
SHIFTpressed - Click into the chart (still
SHIFTpressed and releaseSHIFTwhen the chart is selected) - Right click and select
Group
Now you should be able to write any text into the cell you linked to the Text Box contriol in the second step above(Grouping assures that the control is bound to chart and moves as the chart moves. Both appear as a single entity). Drawback of this is, that you need to Right Click -> Enter Group whenever you need to make changes in your chart.
If the answer is correct or helped you to fix your problem, please click the check mark ( ) next to the answer.
Tested using LibreOffice:
Version: 6.2.5.2, Build ID: 1ec314fa52f458adc18c4f025c545a4e8b22c159, CPU threads: 8; OS:
Linux 4.12; UI render: default; VCL: kde5; Locale: en-US (en_US.UTF-8); UI-Language: en-US,
Calc: threadedHi Opaque - thanks for your quick response (and apologies for asking so many questions, but I’m a new user of LibreOffice).
I tried to insert a form control as you suggest, but after Insert → Form control ->, all the options (Label, Text Box, Check Box, etc are all greyed out.
Hello @Geoff_B - no problem at all regarding number of questions. As you can see in my answer, I’ve posted the information of where I’ve tested. Now it comes to the necessity to know from you where you have the problem (for future questions, it is always a very good idea to add these kind of information from the very beginning). Please tell me your operating system and the LibreOffice version you are using.
But most likely you haven’t ticked Tools -> Forms -> Design Mode
Op system is Windows 7 Home Premium Service Pack 1;
LibreOffice version is Version: 6.2.4.2 (x64); Build ID: 2412653d852ce75f65fbfa83fb7e7b669a126d64;
CPU threads: 8; OS: Windows 6.1; UI render: default; VCL: win;
Locale: en-GB (en_GB); UI-Language: en-GB
Calc: threaded
You guessed right that I hadn’t ticked Tools, Forms, Design mode. All Form Control options are now available!
I’m going to have to call it a day for today, but I’ll try your proposed solution sometime tomorrow.
Many thanks,
Geoff_B
Hello Opaque.
I’ve now managed to try this out, and success! I didn’t bother to Group the text box and chart, as I would tend to keep the chart where it is on the page at all times.
Thanks again for your help on this one.
Geoff_B
Windows 7 Home Premium Service Pack 1; LibreOffice version 6.2.4.2 (x64);
Build ID: 2412653d852ce75f65fbfa83fb7e7b669a126d64; CPU threads: 8; OS: Windows 6.1;
UI render: default; VCL: win; Locale: en-GB (en_GB); UI-Language: en-GB Calc: threaded