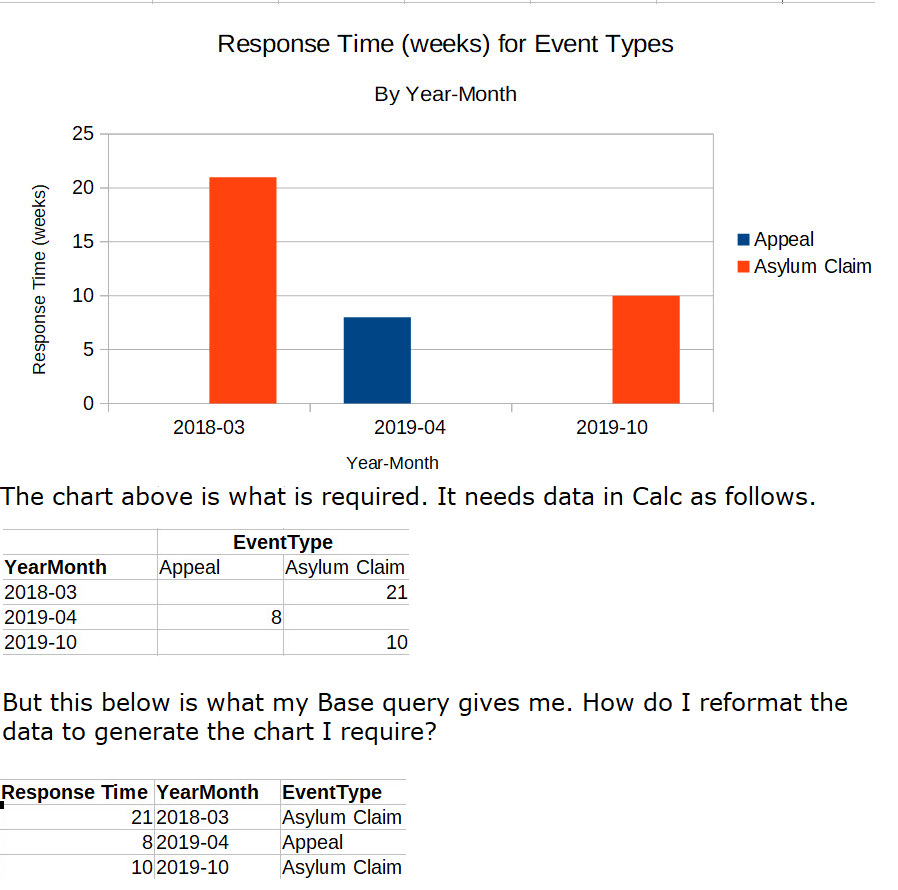
My Base query to which my Calc spreadsheet is linked doesn’t create the data in the right format for the chart I require. How can I reformat the data to produce the chart I require? Details are in this image:
Advice gratefully received.

My Base query to which my Calc spreadsheet is linked doesn’t create the data in the right format for the chart I require. How can I reformat the data to produce the chart I require? Details are in this image:
Advice gratefully received.
Hello,
The best and simplest thing to do is to change the output of the query to put the data in the proper format.
Hi Ratslinger. That’s the problem, I don’t know how to revise my SQL query to generate the data layout I need. I appreciate it might be tricky, so I have a backup approach using a Pivot Table, which will have to suffice if I can’t generate a meaningful chart. So please don’t spend too much time on it.
So please don’t spend too much time on it.
 Nothing I can really do as I have not table/query info about this situation.
OK, fair enough. So, I’m trying to resolve this on my own. I suspect I need to apply judicious GROUP BY statements in my query to achieve the data format I need, so I experiment.
This query works:
SELECT  "EventType", "Outcome"
FROM "EventLog"
This query:
SELECT  "EventType", "Outcome"
FROM "EventLog"
GROUP BY "Outcome"
Produces an error:
*Invalid expression in the select list (not contained in either an aggregate function or the GROUP BY clause)
Both columns are non-computed and are drawn directly from the table. I have read and re-read the Firebird manual on GROUP BY and AFAICS, I am doing exactly what it says. So why the error?
I can supply the real query details if necessary, but I’d prefer to try to resolve this myself through trial and error, but at the moment it’s all Error.
Hello,
The error deals with using a Group By but you are not doing anything like Count(*) or SUM(“someField”).
See this previous post of yours → SQL Query: Help with errors
OK, thanks. I think my problem is that I read the example on page 200 of the Firebird Language Reference as saying the GROUP BY item(s) had to be non-aggregated items - the opposite of what you are saying: ’ ::= ’
SELECT ... FROM ...
GROUP BY <grouping-item> [, <grouping-item> ...]
[HAVING <grouped-row-condition>]
...
<grouping-item> ::= <non-aggr-select-item>
Looks like the subtleties of GROUP BY are eluding me, so I’ll make do with Pivot Tables. Thanks for your help anyway.
No, that is not what my comment stated at all. Best probably to stick with the Pivot Tables.
It’s available to create a pivot table linked a base query, with a pivot table you can organize the data as you like. Also with latest versions is possible to create a chart from the pivot table Pivot chart.
Thanks m.a.riosv. I have created a Pivot Table, but when I follow the instructions for creating a chart from a Pivot Table, I just get a blank chart. Data Range and Data Series options are greyed-out. Can you comment further?