How to highlight highest and lowest values in LibreOffice Calc

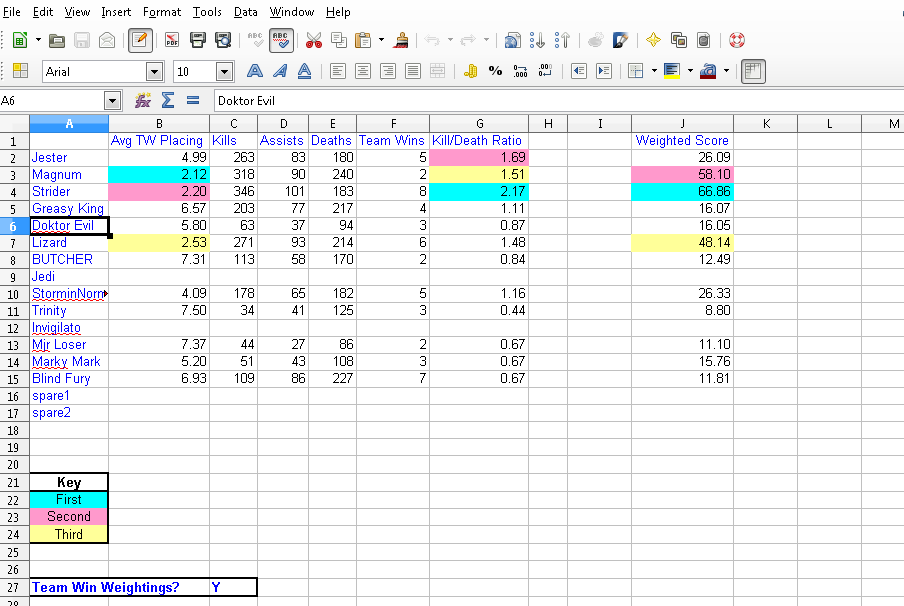
I am making a stat sheet for a Lan party I am having. I would like to highlight the highest and lowest values in each column. For example the three people with the most kills with have their kill count highlighted.
I have an example but do not know how to replicate it.

(Edit: activated screenshot -AK)

1 Like

There is needed to use conditional formatting (Menu/Format/Conditional Formatting), a better explanation about the new conditional formatting in 4.x branch is founded in documentation:

https://wiki.documentfoundation.org/Documentation/Publications#LibreOffice_Calc_Guide
4.x.branch
2 Entering, Editing, and Formatting Data. - Using conditional formatting (page 29)

Also a video:
http://www.youtube.com/watch?v=zXQnBGMIZnY

20161215 Edited

Added a sample file with a conditional format to color 3 largest and 3 smallest values.

ConditionalFormat_Laargest_Smallest.ods

I hope more understandable now.:slight_smile:

1 Like

The question you are answering is not answered in the links you provided

Indeed, this answer absolutely doesn’t answer the question, or if it does it’s well hidden.

Agreed. If one can highlight the top value in a column, row or area, one woul imagine this would be an easy fix.

1 Like