Hi All,
Am using V6.3.5.2 on Ubuntu.
I have imported a 1MB CSV file and have produced a detailed graph which is perfect.
What I can’t do is obtain the values of my plots when I hover the mouse over the data.
Any suggestions ?
Cheers,
Bob.

Hi All,
Am using V6.3.5.2 on Ubuntu.
I have imported a 1MB CSV file and have produced a detailed graph which is perfect.
What I can’t do is obtain the values of my plots when I hover the mouse over the data.
Any suggestions ?
Cheers,
Bob.
I’m using LibreOffice 7.2.4.1 on a new Macbook Pro (M1 Pro) and hovering over chart lines only shows the column name (e.g. Column B) or column title.
Hello,
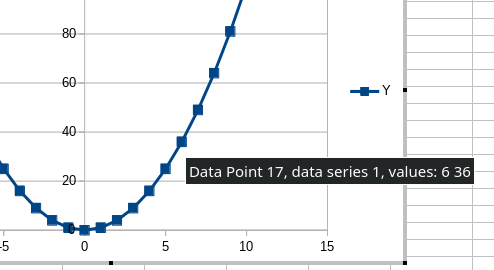
you need to be in Edit mode of the chart.
Right click -> Edit – or – Double click into the chart (grey border appears)Now you can hover over the data points and get some values.
[Update 1] (as per request in comment)
Tested using LibreOffice:
Version: 6.4.4.2, Build ID: 3d775be2011f3886db32dfd395a6a6d1ca2630ff
CPU threads: 8; OS: Linux 4.12; UI render: default; VCL: kf5;
Locale: en-US (en_US.UTF-8); UI-Language: en-US, Calc: threaded

Version: 6.3.6.2, 074d8a661f4036fca8fa0cbfa33a497
CPU threads: 8; OS: Linux 4.12; UI render: default; VCL: kde5;
Locale: en-US (en_US.UTF-8); UI-Language: en-US, Calc: threaded

Version: 6.2.8.2, Build ID: f82ddfca21ebc1e222a662a32b25c0c9d20169ee
CPU threads: 8; OS: Linux 4.12; UI render: default; VCL: kde5;
Locale: en-US (en_US.UTF-8); UI-Language: en-US, Calc: threaded

Version: 5.4.7.2, Build ID: c838ef25c16710f8838b1faec480ebba495259d0
CPU threads: 8; OS: Linux 4.12; UI render: default; VCL: kde4;
Locale: en-US (en_US.UTF-8); Calc: group
[Update 2] This doesn’t work on any of my GNOME/GTK3 based test systems (Ubuntu 18.04 / 20.04 , Fedora 32) and seems to be a bug.
Hope that helps.
If the answer helped to solve your problem, please click the check mark ( ) next to the answer.
No, that didn’t work for me. I changed the graph type to point and lines, but still does not show values.
The chart type doesn’t matter at all. If that doesn’t work for you it might be a bug in your Ubuntu Version of LibreOffice (if used). You may upload a sample file, to check whether it is specific to the file.
In addition, you wrote:
V6.5.3.2 on Ubuntu.
This version does not yet exist - so please correct.
Corrected.
In the original post, I attach a simple graph made with my version.
Please detail which version you are using too.
Thanks,
Bob.
Edit: I can’t add an attachment to the original post. 
Can’t find an attachment. Versio info - see Update in my answer (but I even can’t remember the time where it did not working that way).
To clarify:
I’ve edited the original post to show the correct version I’m using.
I am unable to upload an attachment to the original post too. Though I’d like to know which version you’re using.
Thanks for your help so far.
Bob.
Now you can add using the clip symbol
![]()
I tried the clip feature, but no joy.
Regardless, I’ll download and install 6.4.4.2 and give that a go and report back.
Just checked on an Ubuntu Testsystem and I got the same problem when using 6.3.5.2 from launchpad PPA. Doesn’t work with 6.4.4 from libreoffice.org either (even after reset of user profile). Seems to be an issue with GNOME/GTK3 - if using SAL_USE_VCLPLUGIN=gen libreoffice6.4 it works.
Some good news. I did a search for SAL_USE… and found the following link: https://bugs.documentfoundation.org/show_bug.cgi?id=130090
At the CLI I started LO with “export SAL_USE_VCLPLUGIN=gen ; libreoffice” and now I have values displayed when I hover over the data.
Many thanks for your help. Bob.
At the CLI, I started LO with “export SAL_USE_VCLPLUGIN=gen ; libreoffice &”