Hello!
It is probably super easy, but does somebody have mercy with me and point me in the right directions to edit the central hole (pink arrow in below image) of a donut chart?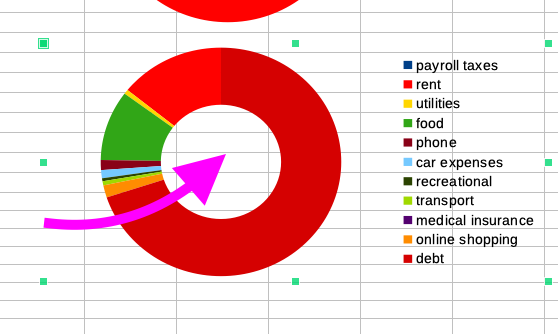
TY
Sophia
EXAMPLE FILE: example1.ods

Hello!
It is probably super easy, but does somebody have mercy with me and point me in the right directions to edit the central hole (pink arrow in below image) of a donut chart?
TY
Sophia
EXAMPLE FILE: example1.ods
Please upload your ODF type sample file here.
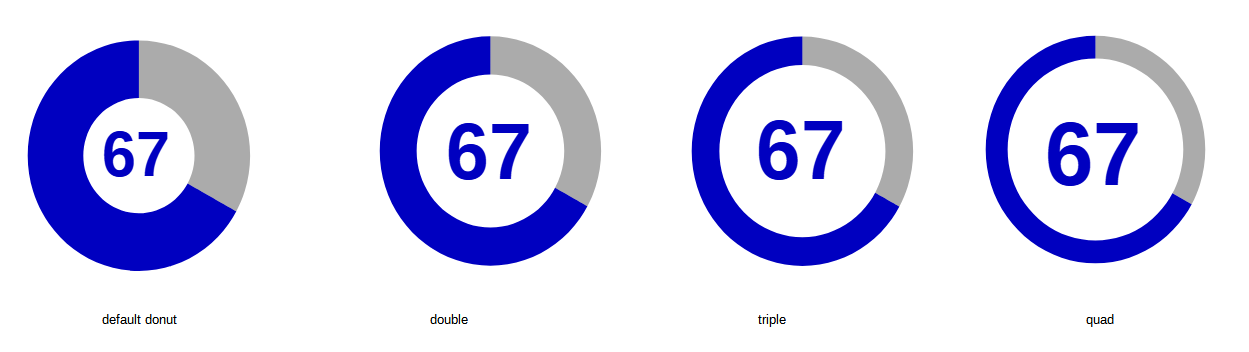
This thread helped me discover another option to control the donut hole size. LibreOffice Calc supports multiple concentric donuts. The more donuts there are, the thinner they become. Give the inner donuts zero or null values to make them empty/transparent. Source file: donut.ods
Genious workaround!
Hello,
i could not find a way to manipulate the shape of the donut, but i
found, that one could easily “fake” the opening of the area,
by overlaying a round shape over it.
This is how you do it.
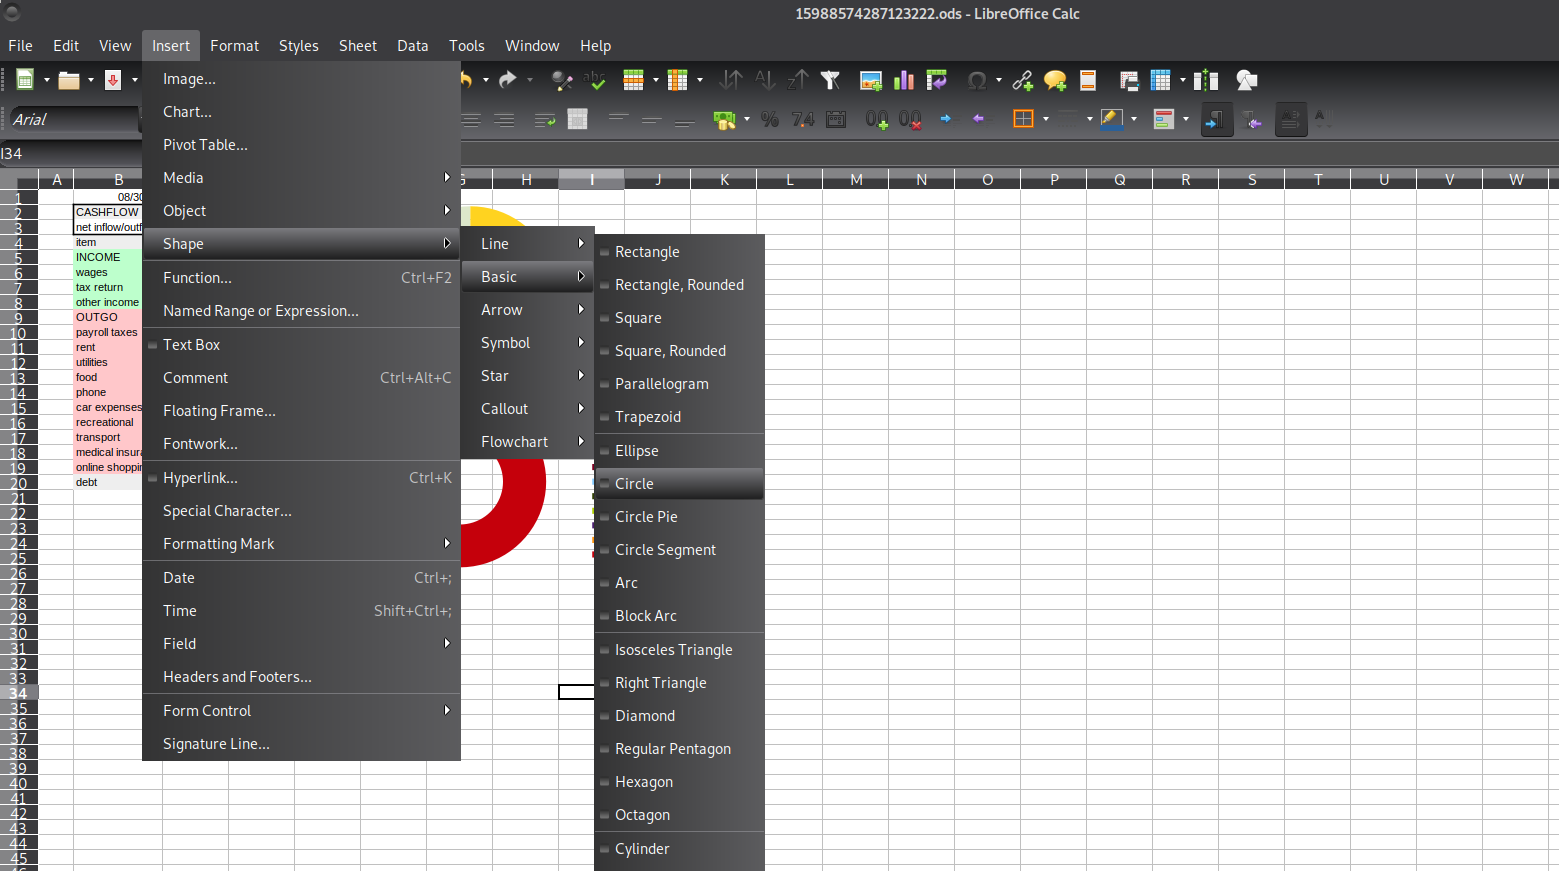
Create a Circle Shape like this:
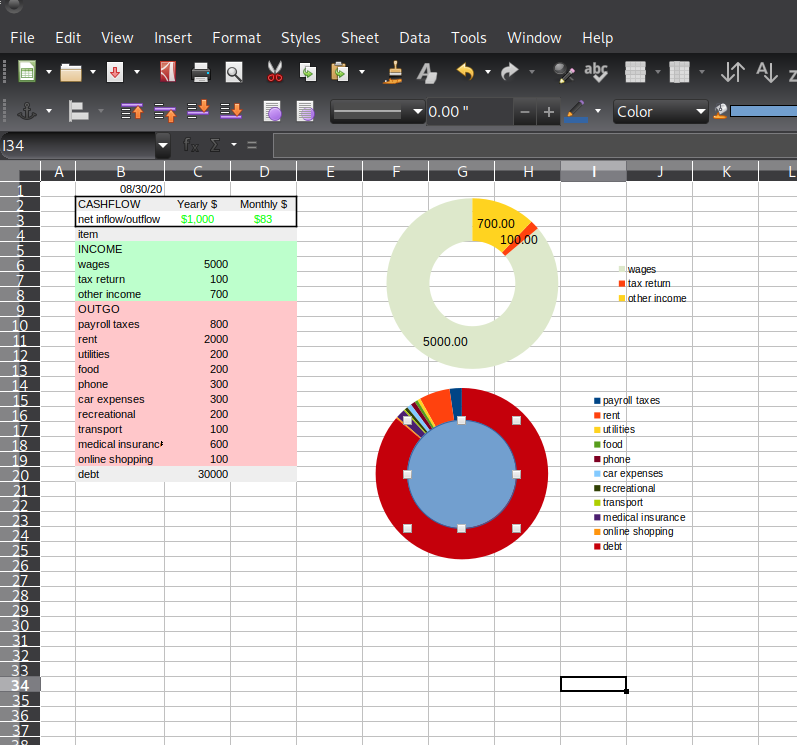
Place it in the in the center of the donut
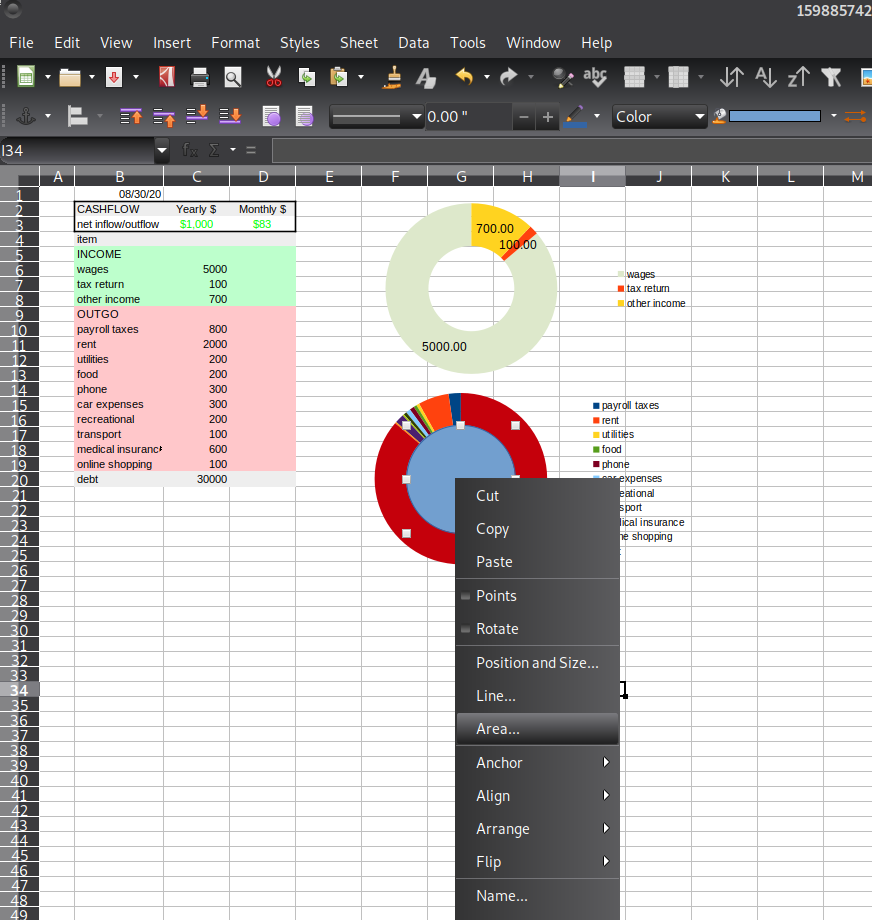
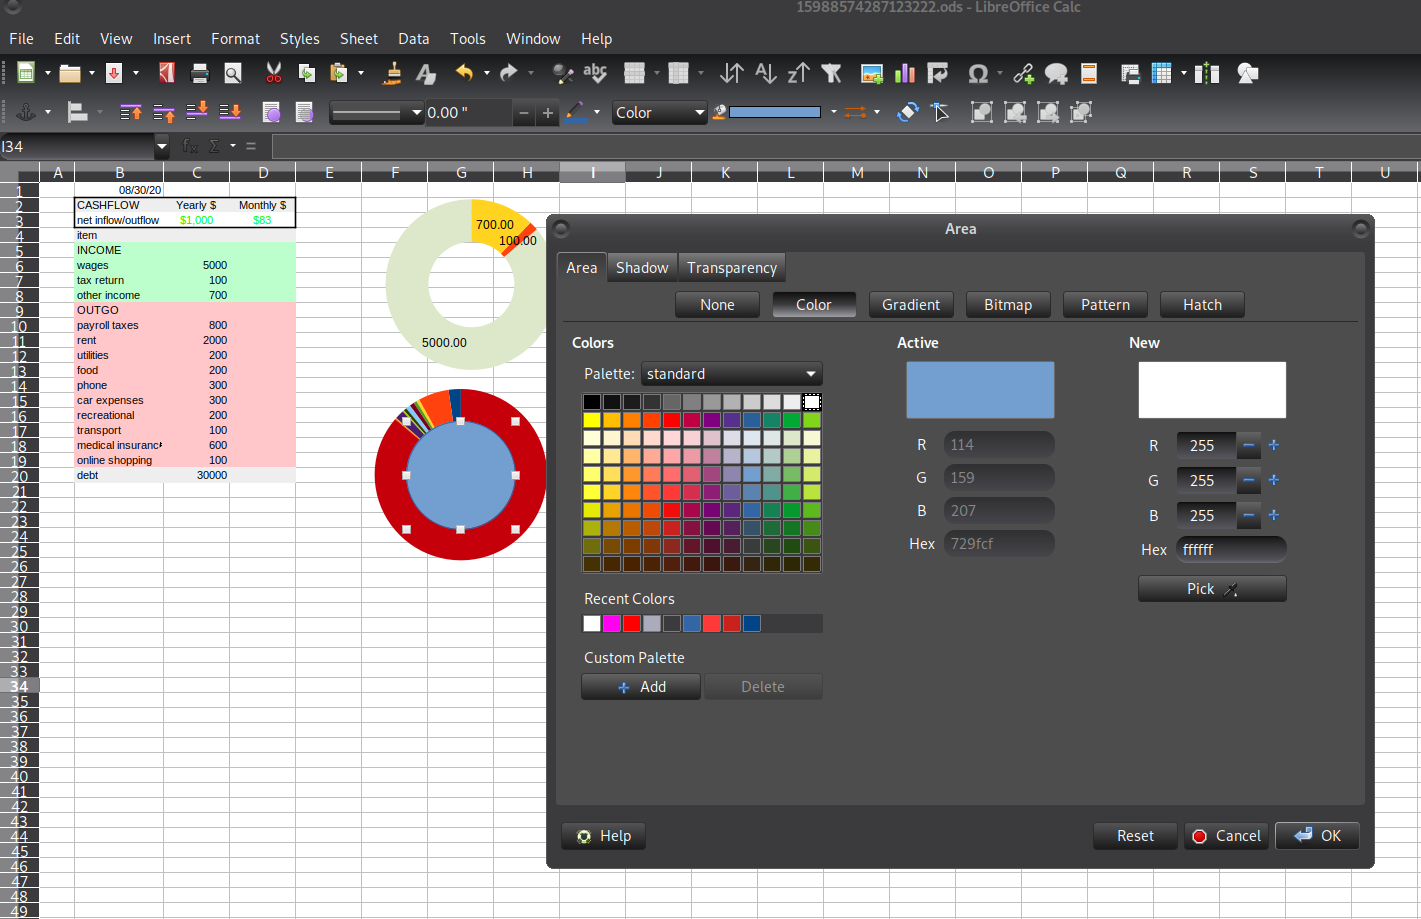
Change its “area” color to white
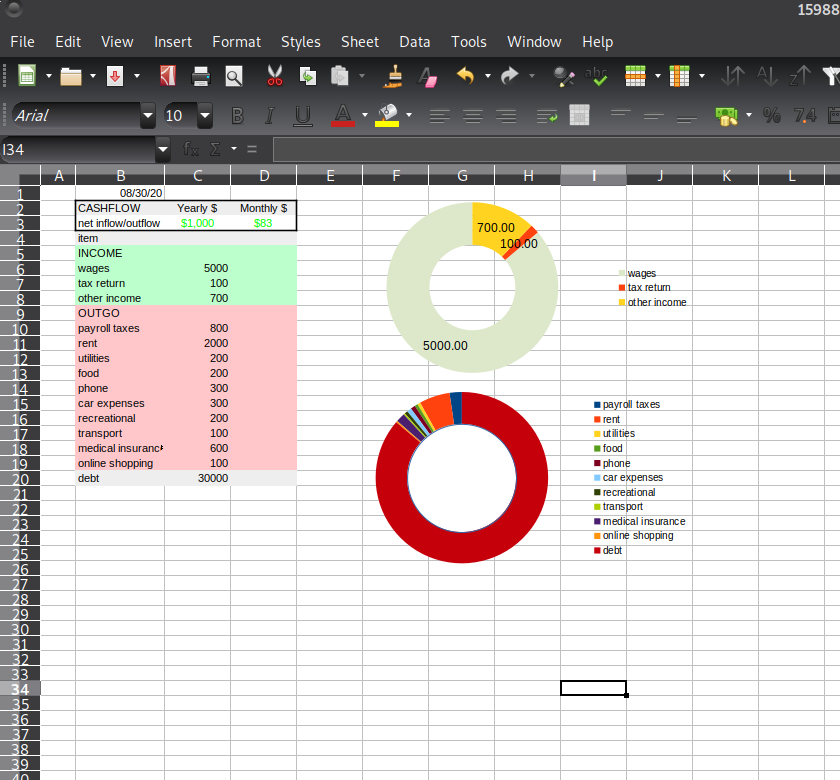
That’s it. The Final result should look like this.
Hope that it helps.
To show the community your question has been answered, click the ✓ next to the correct answer, and “upvote” by clicking on the ^ arrow of any helpful answers. These are the mechanisms for communicating the quality of the Q&A on this site. Thanks!
Have a nice day and let’s (continue to) “Be excellent to each other!”
Looks to me, that you get the same effect by using a regular pie chart and overly the shape or use the “doubledonut” workaround, @Zizi64 suggested.