EDIT:
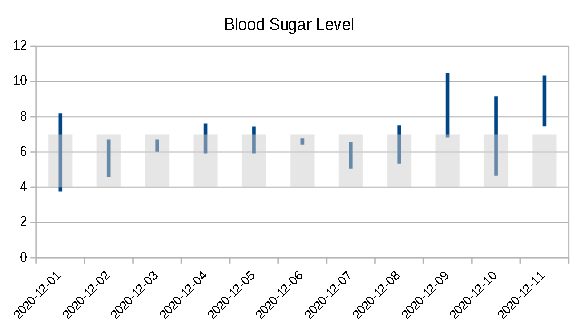
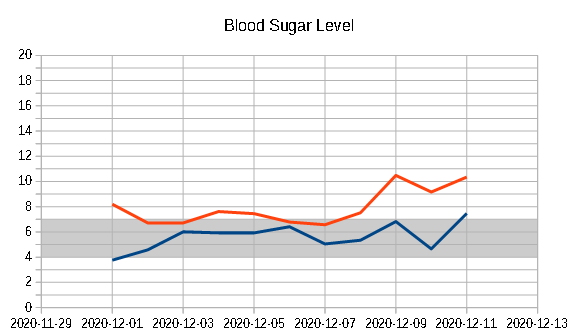
A third option (a bit better one, but that also does not respect the time scale) could be to use the chart type Stacked Columns and Lines.
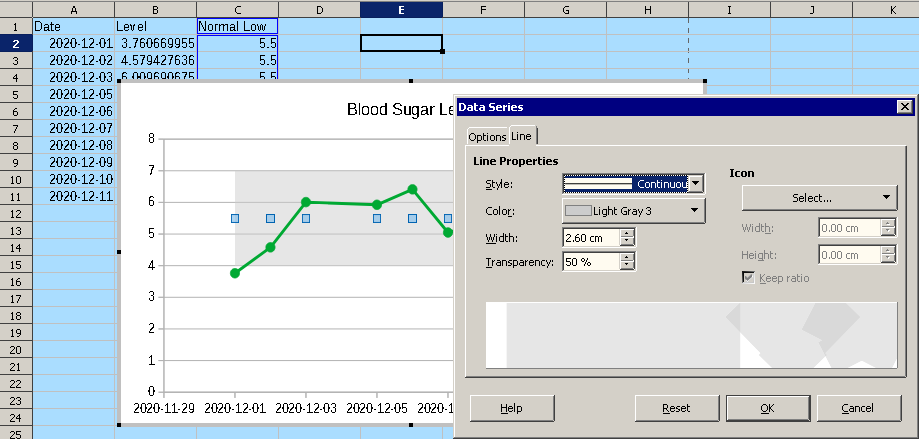
Normal Low column (with value 4) in white, Normal High column (with value 7-4) in gray, and Blood Sugar Level as line.
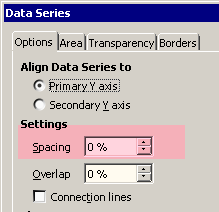
Column spacing is set to 0% and borders style to none.
A fourth option (that respect the time scale), is to use the XY (Scatter) Chart Type, and put a second line midway between 4 and 7 (the acceptable range), with a wide Width.
If the Y axis scale is not set to specific values, it is quite possibly that, at some point, it would be necessary to adjust this width.
The same applies to the white spaces to the left and right of the chart, if X axis scale is set to automatic.
Seem that my previous answer (below) points to a diastole-systole chart.  /EDIT.
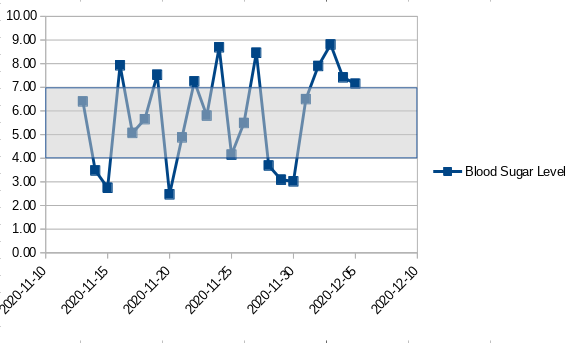
The not so easy way: Use a Stock Chart 2 type.
Set first column as label.
Once done, edit and…
- Format Stock Gain Border to none, Area Color to gray and Transparency to 50%.
- Format Data Series Line width to 1 mm
See sample file (with no real data).
The hard way: In a XY (Scatter) chart, add a white rectangle shape as a background replacement, a grey rectangle shape in front of the white one, and place in top of them the chart with the chart area set to none, and fix the Y axis. Once the three are in place, group them.
Made with LibreOffice 6.4.7.2 (x86); OS: Windows 6.1.
Add Answer is reserved for solutions. If you think the answer is not satisfactory, add a comment below, or click edit (below your question) to add more information. Thanks.
Check the mark ( →
→  ) to the left of the answer that solves your question.

 )
)