
A suggestion for a minor change, rather than a “How do I?”:
On an X-Y Scatter chart it is possible to change the axis scaling. If the x axis, for example, is a time base with values to the nearest second, then the edit box on the “Format Axis… > Scale” dialog is too short to contain the date and the time, example attached. It is possible to resize the dialog, but the box does not expand in line with this. It would be useful to have the whole date and time visible.
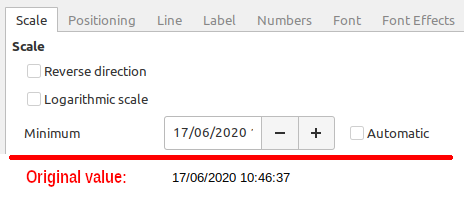
(Edit: activated screenshot -AK)