
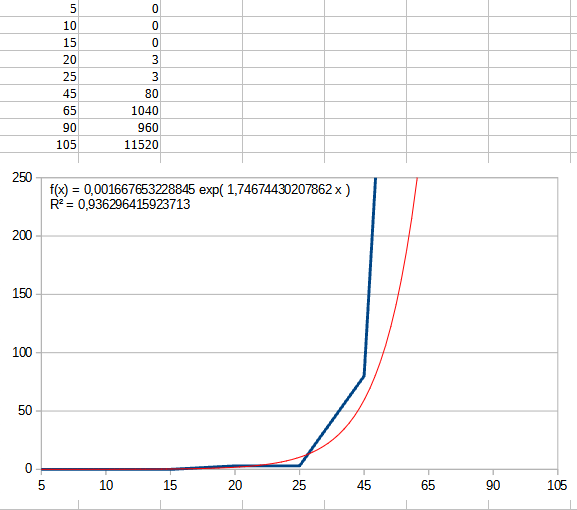
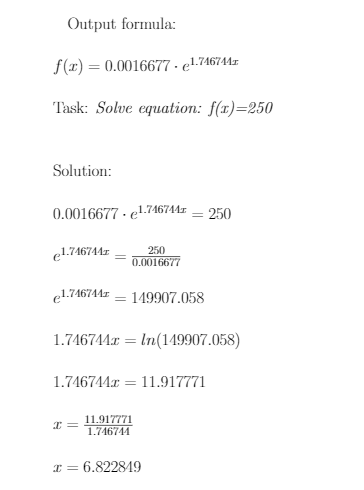
HI everyone! I need to find x coordiante of the point where y = 250 using exponential trend line function. Given formula by the Libreoffice Calc, we can find that the actual x coordianate should be roughly 6.8, but on the screenshot we can see that the trend line (red color) equals 250 in the point 55-ish which isn’t match with what we found using equations. Given this information I believe that there’s problem with trend line representaion.
 What could cause this problem? Is there a problem or I just can understand smth? Thank you for an answer in advance.