Edit legend on chart

Hello,
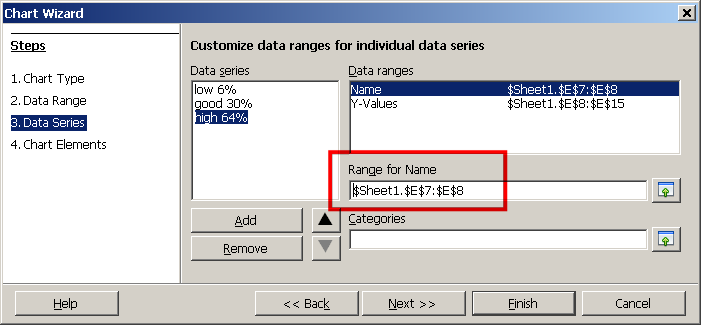
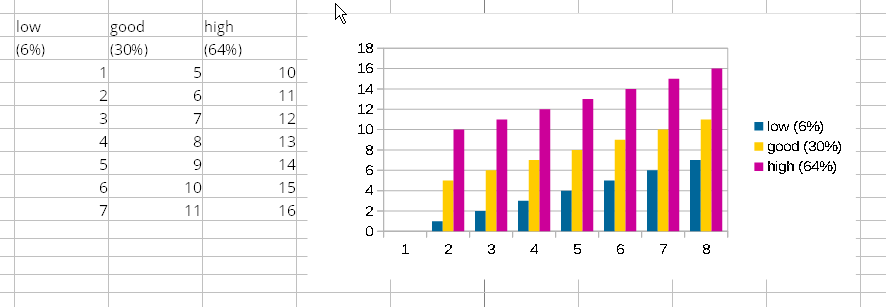
I have a little problem. I would like to add to legend of chart a value of cell. Example I have 3 columns (low, good, high) with value 6%, 30% and 64%.
Now in legend i have only:

[] low 
[] good 
[] high

I want:

[] low (6%)
[] good (30%)
[] high (64%)

The point is that you need two cells for one legend name. One cell contains “low” and the other contains “(6%)”

Open the following dialog window and adjust the range for each “Name” to contain the two cells for one of you legend names you want.

Next picture shows how data and legend name are arranged. Note that for simplicity I did to prepare an x-axis but Calc creates a default x-axis.

Out of curiosity: Who does insert the space between “low” and “(6%)”? Ist it entered into E7?

@Lupp - Calc does it by itself. Nice feature.

@ROSt53 And what to do if I dislike the space? I want control. Had enough bother with nice features.