In Calc, can I remove the extra line from a line graph?

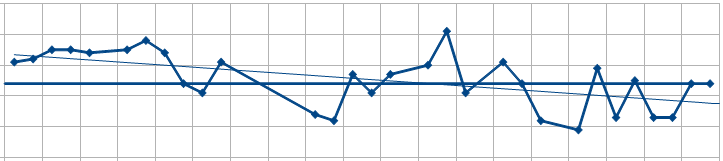
When creating a line graph, Calc adds a line extending from the beginning of the line graph to the last data point. I also added a trend line, so this extra line is not a trend line.

Evidently there is some dumb rule about needing 3 points before I can upload a screenshot or I would have done so.

Thanx all

You should now have the points. Please upload or link the screenshot / example file.

Any input?
Thanx

Hopefully this works now, and I can upload. In the screenshot you can clearly see the lighter trend line, but it is the darker flat blue line I am wondering how to eliminate.

Thanx

Anyone? Bueller? Bueller?

Bueller? Beuller?

LOL. What is that line? Can it be selected? If it can be selected it should indicate what it is on mouse-over when editing the chart. My guess would be a Mean Value Line or a wayward data series. For the former: edit chart; right-click on the data series; select Delete Mean Value Line.