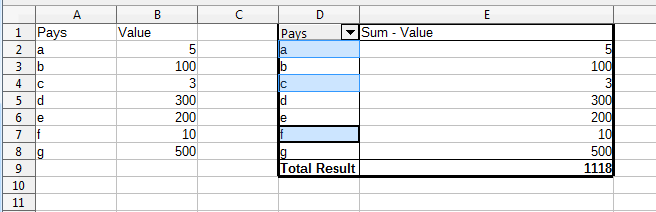
I have a pivot table summarizing numeric values per country (say, kilos of pasta consumed per year), sorted in descending order by amount consumed. For reasons, 4 countries represent over 90% of the total consumed, so that the remaining 10% is distributed across the rest in negligible amounts.
In Excel, I was able to Group those other countries into their own category (“Others”), aggregating their consumption, yielding cleaner tables and graphs (my table/graph now had 6 data rows, instead of 20-- one for each of the 4 big countries, the “Others,” and the Total), making the whole thing easier to read.
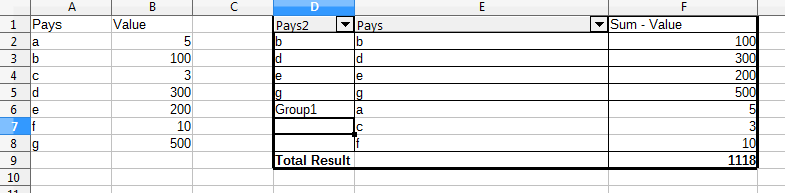
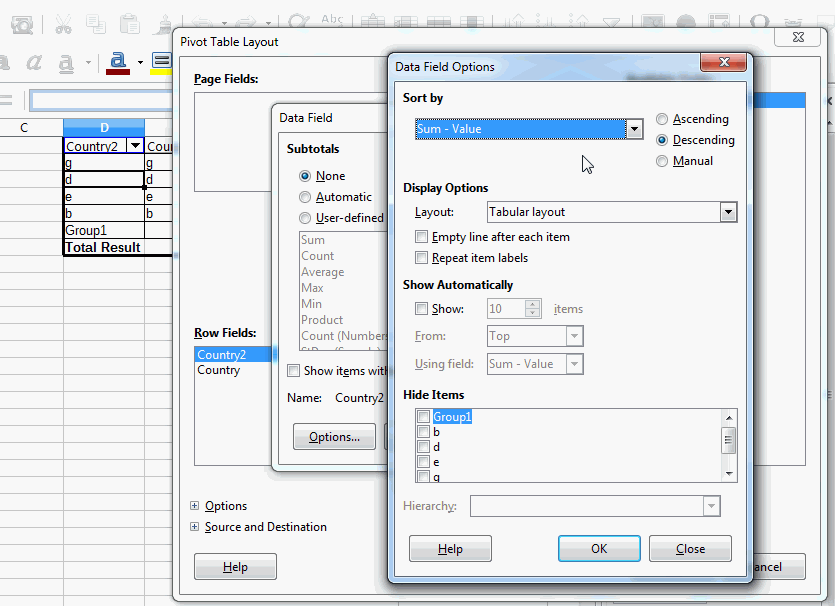
When I try to do the same in LibreOffice, countries get grouped in alphabetical order (the default order, rather than by volume, the sort order I set), creating a useless mess: I have the Others category, but it doesn’t contain the right countries.
In theory, I could do it manually, by adding a column Country2, and using VLOOKUP to flag as Others the smaller countries. But that seems overkill: there should be a way to do it automatically.
Is this a bug?