
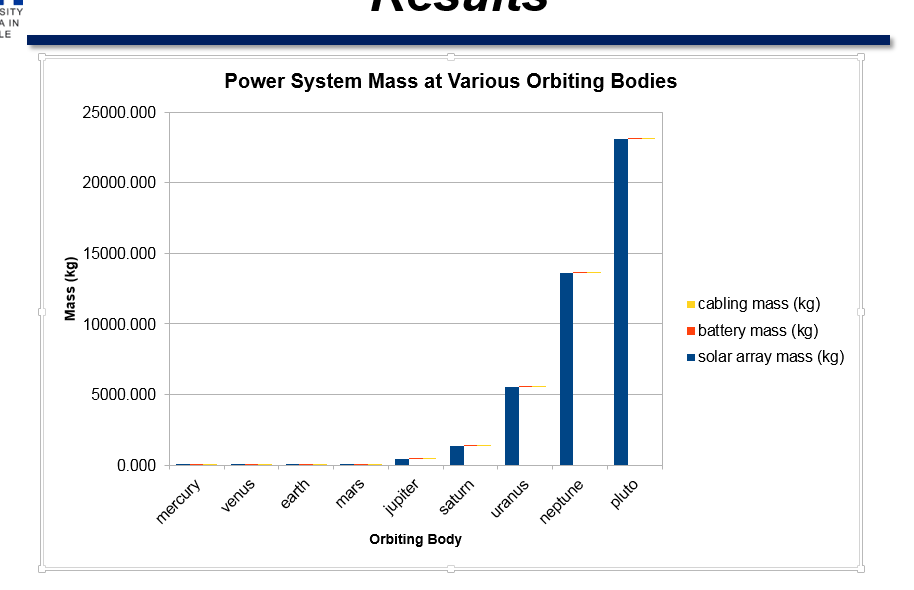
Hello, I am having issues with trying to replicate a graph on libre. I can’t add pictures yet but I will try to explain to my fullest. The y axis is mass and the x axis is the orbital body ( Merucry, venus, earth etc.) My issue is, I am plotting 3 different masses and they all have to show. The stacked feature is the type required but since the other 2 masses are extremely small, it is recommended that they stagger. A crudely typed example is shown below. How do I accomplish this. The small values are on top of the big value which is why stacked seems like the only option.
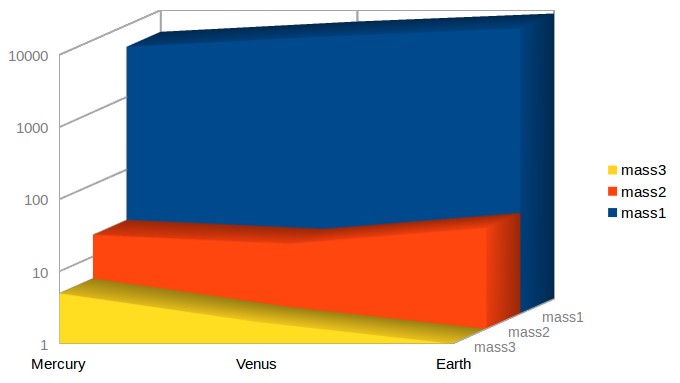
Hello MusicG, you could do this by setting the Y-axis to logarithmic.
1) In your chart, right-click on the Y-axis and select the menu item called "Format Axis...",
2) In the dialog that pops up, select the tab called "Scale",
3) Check the option called "Logarithmic scale".
It results in a chart like this:
(edit: activated screenshot)
Sorry I can see where my crude picture leads to that statement. What I mean is that there are 3 bars in each planet. Mercury will have 3 separate bars but in a stacked fashion.
that would be a matter of setting the Chart Type to “Column” instead of “Area”
You could upload your image to an external site such as imgur, and paste the URL here.
i also upvoted your question, so you gain “karma points” to upload images here…
I called a friend up to help with this quick timed issue and resolved the problem. I would like to thank you for still helping out. I posted the image just in case you were wondering what I was talking about.