
I want to plot data from 3 columns {A, B, C}. B contains x-values, C contains y-values and A contains the name of the data series where I want the corresponding x and y value to be.
Is there a simple way of doing this?
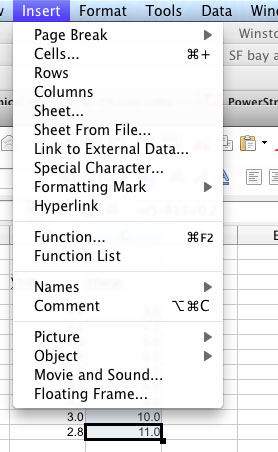
Yes, there is. Select the data, click on Insert, Chart, XY (Scatter), Finish. Or even faster if you press the Chart button on the main toolbar (it’s the red Pie with a percentage sign on top)
Pedro, what version and operating system are you talkng about please? I do not see Insert > Chart.
Edit: OK I see it. It is under Insert > Object > Chart.