For log plots, the only labels are on 10, 100, 1000, etc. How do I also add labels to 20, 30, 40, 50, …?
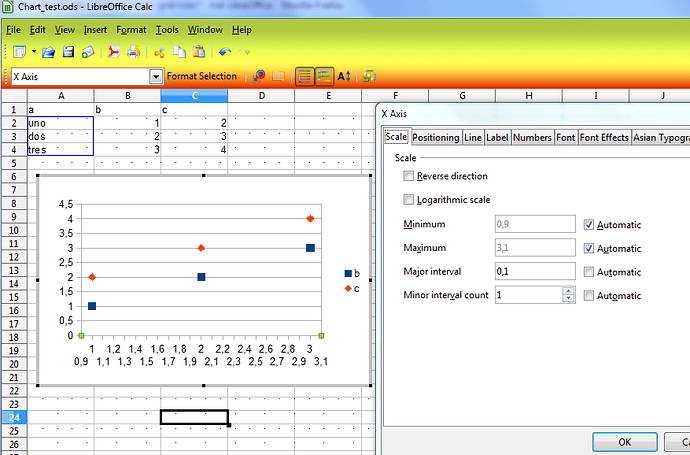
I think there is no option, but you can change the scale for major to view more labels, and play with positioning in Label tab for a better viewing.
@endolith question is a good one and so is @mariosv’s answer.
There is an additional element in endolith question. If I am right, he would like to have sub unit lines between the 1, 10, 100. 1000, etc. This is currently not possible in LibO. Triggered by mariosv’s screen shots I looked at it.
I created a row of values ranging from 1 - about 1800 to go across 3 orders of magnitude. Next, I made a chart and flagged the y-axis as “log” and got the correct chart.
Playing with the major and minor interval does not allow to create logarithmic sub units (grid lines) between 1-10, 10-100, 100-1000, etc
Therefore, I think that adding the feature of having logarithmic sub-units as an option would be an interesting thing. I would like to encourage endolith to bring this topic forward as an enhancement request included should be the possibility to have also and logarithmic x-axis.
As MS EXCEL (2003; can someone check the newer versions?) has only the features like Calc now, the enhancement would make Calc very interesting for a people who need to work with log- or double log charts.
Here is a article on logarithmic scaling:
"sub unit lines between the 1, 10, 100. 1000, etc. " Yes, like http://sphaerula.com/legacy/R/logLogPlots.html or http://www.lhup.edu/~dsimanek/scenario/errorman/graphs2.htm
An enhancement request is filed. Please add comments.
@endolith - Yes the links you posted show exactly what you like to have. I think these lines are very important. Therefore, please file an enhancement request (= bug report with “enhancement” in the subject line.
It would be nice if you post the link here.
takes too long 
@endolith - Your answer is at least very honest. How long does it take to post an enhancement request? Something like 15 - 20 min? How much time do you think all the answers (incl. searching and testing) to your question took? Just some food for thoughts.
@ROSt53: I’ve spent a lot of time filing feature requests and bug reports, and they are just ignored.
@endolith - thanks for filing bug reports and sorry to hear that you are the impression that they are ignored. Could you possibly list these bug reports here?

