
I can add data labels to all points on a line. Can I, and how, add one data label to the end point of the line?
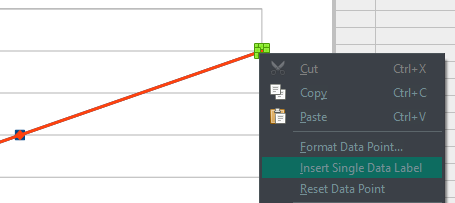
The key is to select a single point. Try clicking on the point a few times until it gets selected. Then right-click on the point and choose Insert Single Data Label.
Thanks, Jim. But regret it does not work for me. I’m using LO v.5.1.4.2 which is the latest. Also use stepped line. Though I’ve found a way around! Click on ‘Chart Type’ and change to ‘Columns’. Select last column and click. Select ‘Insert Single Data Label’ enter label details. Label appears with last column. Click ‘Chart Type’ and change back to ‘Stepped Line’. There is the label by the last point!
Christopher W.
You now have enough points to edit the question and attach an example file. Or, if you are happy with the Columns workaround, then post it as an answer and mark it as correct to close out the question.
I’m using LO v.5.1.4.2 which is the latest. Also use stepped line. Though I’ve found a way around! Click on ‘Chart Type’ and change to ‘Columns’. Select last column and click. Select ‘Insert Single Data Label’ enter label details. Label appears with last column. Click ‘Chart Type’ and change back to ‘Stepped Line’. There is the label by the last point!
1 Like
Still relevant in 2023, the only way I have found to do this is to add to the labels to the line - which adds it to all points - then manually delete each label except the last one.
It can be time consuming but gets what the OP is asking for and something I use a lot. One day I’ll get around to writing a macro. Until then…
- Double Click the Chart
- Select the first line
- Right-click->Insert Data Labels
- Double click on any data label->choose type (in my case “Series Name”)
- Click Ok
- Click each data label you don’t want. Press ‘Delete’ on keyboard.
- Repeat
- Move remaining labels to desired position by clicking on then (selecting) then click&drag to position
Here’s my example:
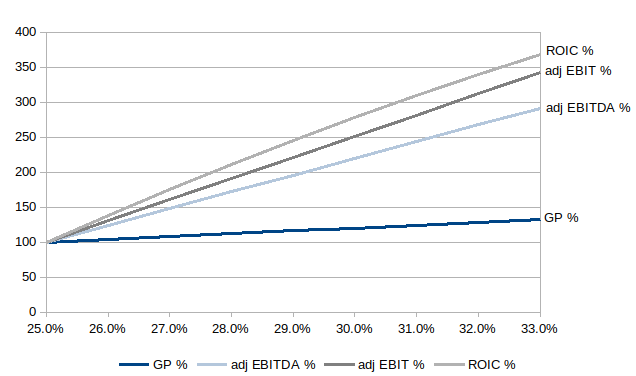
Using LO v.7.5.6.2 Community
2 Likes
Thank you for your workaround.
Unfortunately, it unfortunately is reasonably inapplicable to graphs with hundreds of data points.
But even on small graphs, I am still unable to select a single data point to this day. I hope this issue will be addressed in future updates, and that modifications will be made to the LibreOffice guide as it still gives instructions for this function which doesn’t work.
My version : 24.8.4, latest release to date
See my answer of May '20 above. I now use the latest LibreOffice 24.8. I’ve just tried my method with a line chart, changed it to columns added series name to last column and then changed format back to line. Hope this might work for you.
can data labels be spread out from CENTER ??