Like these black hand drawn numbers in this example:
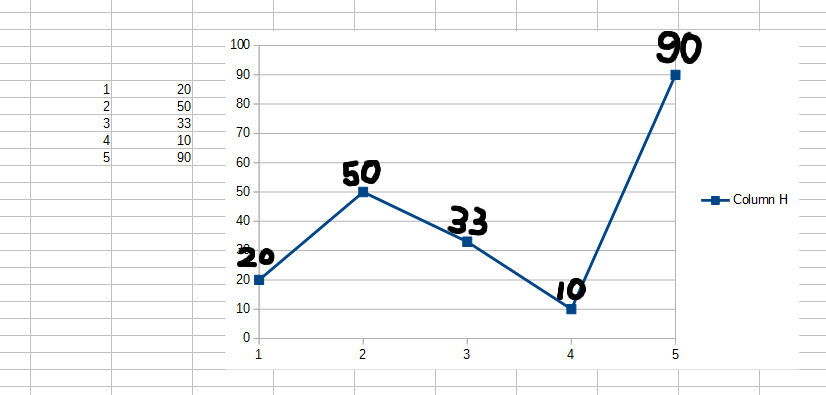
(edit: added screenshot -AK)

Hello,
First double click on chart to select it. Next left click on line to select then right mouse click & select Insert Data Labels. Then to modify, right click again & select Format Data Labels....
Thank you.