How to make different net charts with same 0-100 range, when data is so different?

Hello!

Apologizes if I’m not good with explaining it in title. I’ll try to use examples for this.

I need to make net charts and show them in comparison with one another, range being 0 - 100.
But no matter what I do, I can not get chart to retain 0-100 range when highest data in specific chart is only 50.

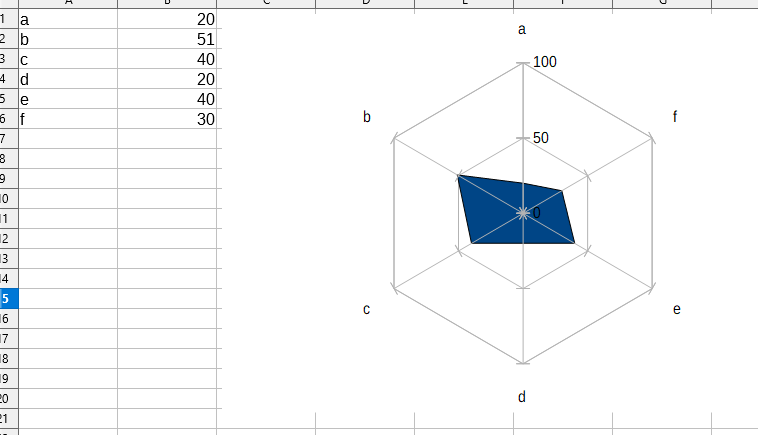
For example, when highest data is 51, ranges are from 0 - 100 as needed:

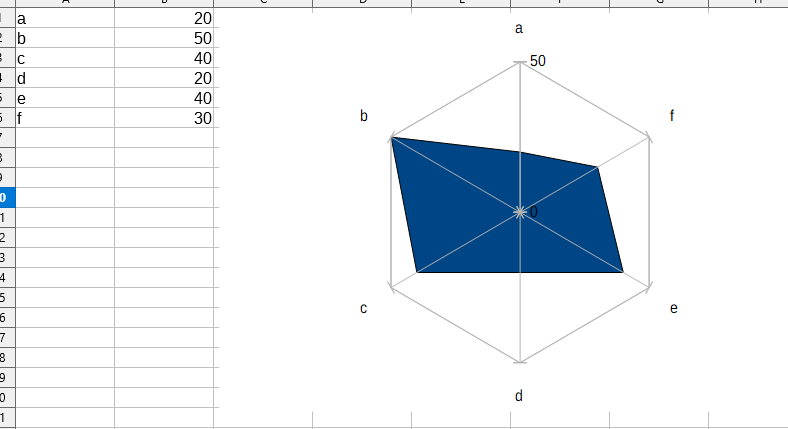
But when highest data is 50, ranges drop to 0-50.

I need to have several of them next to one another for specific presentation, all with ranges 0-100 to show visual differences and it fails if one chart has range 0-100 and other 0-50.

Is there a way to make chart stay 0-100 even when highest data in it is below 50?

See answer below.

Yes.
Double click on the offending chart. Let the cursor hover over a radial line on the chart. A pop-up will say “Y axis”. Right-click at that point. A dialog box will appear. Choose Format Axis. Another dialog box will appear. Choose the “Scale” tab which will give you options to change and edit the scale of the y-axis. Be sure to uncheck “Automatic” and enter the values that you want (maximum = 100).

When you are done, click OK. Then click on an empty cell away from the chart to take it out of edit-mode. Be aware that some (many?) changes will not actually be displayed until you take the chart out of edit-mode.
As far as I know, most or all charts can be edited in this way. Being able to format the axes is a very valuable tool, and I use it often myself. Similarly you can also edit the axis labels, titles, data point symbols, etc. Right-click on an object and choose your weapon, as they say.

If this answer helped you, please accept it by clicking the check mark :heavy_check_mark: to the left and, karma permitting, upvote it. If this resolves your problem, close the question, that will help other people with the same question.

Perfect and extremely helpful answer! THANK YOU!