How do I export a chart plus drawing objects in an image format from LibreOffice Calc?

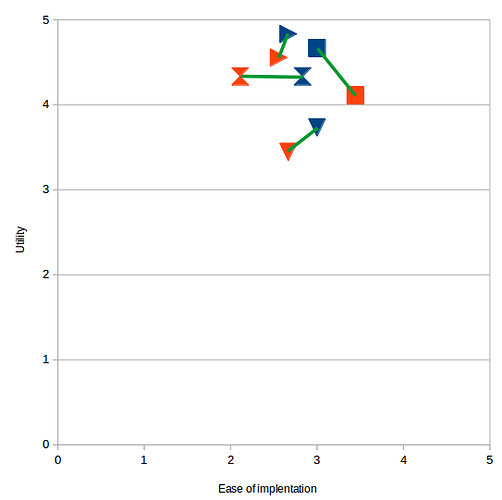
I have created a chart within LibreOffice Calc which I have used the drawing tool to add drawing objects to (e.g. drawn lines connecting some of the data points).

How do I export the chart as an image whilst also exporting the drawing objects? Normally to export a chart as an image you right click on the chart and select ‘Export as image…’ however doing so saves the image without the drawing objects.

The only way I can figure to do this is to take a screenshot, but I’m assuming that has lower resolution (the file will be included in a thesis so I want the resolution as high as possible). An example screenshot of the chart is below, where the green lines represent the drawing objects.

Thanks for your help.

For me all drawing objects are included. You need to select the chart so that it has green handles. Do not activate the chart. You get higher resolution, if you use menu File > Export. Make sure “Selection” is checked. First choose the dpi. 300dpi are enough for printing. Then choose the desired target size. A simple screenshot has 72dpi, 96dpi or 120 dpi for example, depending on your operating system and your settings there.

A very different way to get a high resolution image is via pdf-export. In the pdf-export choose “Lossless compression”. Then open the file in Acrobat-Reader and use its Snapshot-tool. If you use a high zoom, so that the to be selected area is larger as the screen, the Snapshot-tool will scroll while selecting. Then paste the clipboard content to an image processor app.