Hello,
I am trying to create Net Charts to have some visual representation of risks.
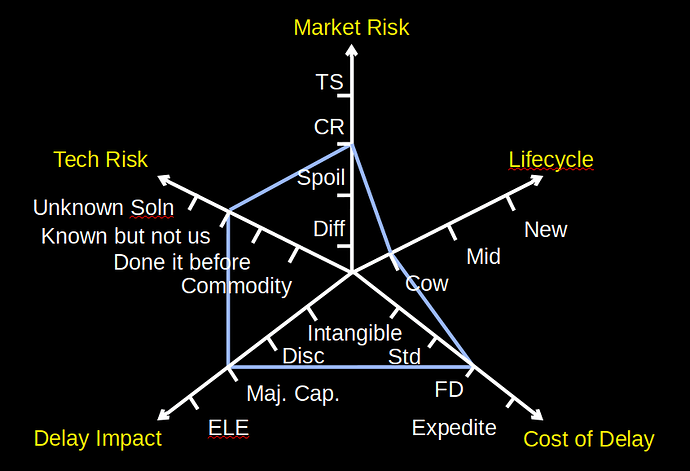
Here is what I am trying to achieve for reference:
As you see, each point on each of the 5 axis has a text label.
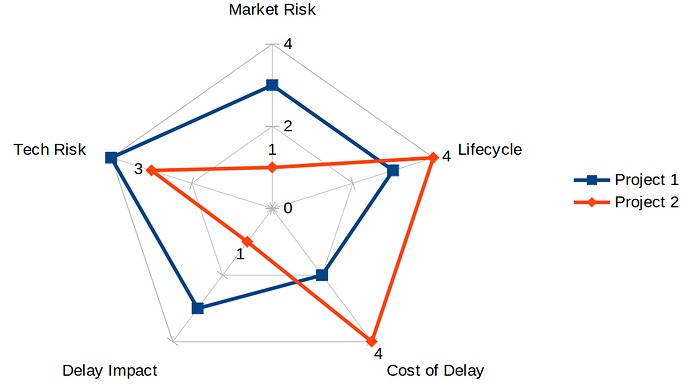
I was able to create this, already quite useful, but I have some problems with it:
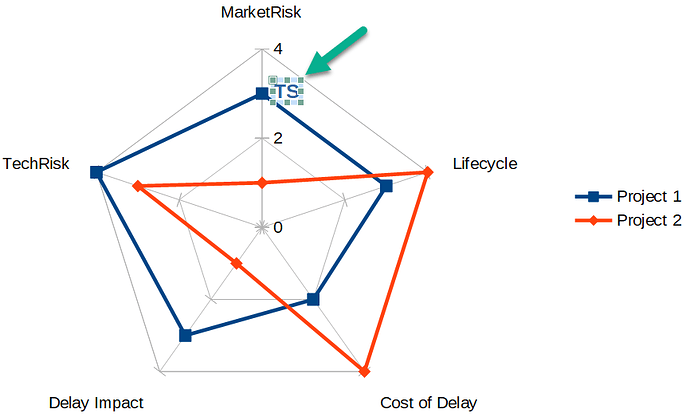
- How can I put some text labels along
the axis? - How can I make sure that
all axis are scaled to 4 even if my
data doesn’t reach 4 with any of
them?
Thanks!


