Labels and scale for data points and axis in Net Charts

Hello,
I am trying to create Net Charts to have some visual representation of risks.
Here is what I am trying to achieve for reference:


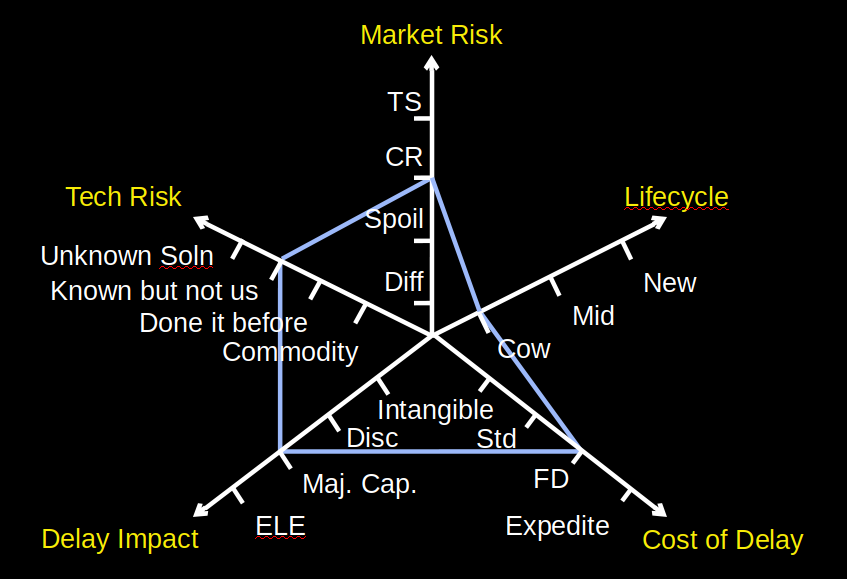
As you see, each point on each of the 5 axis has a text label.

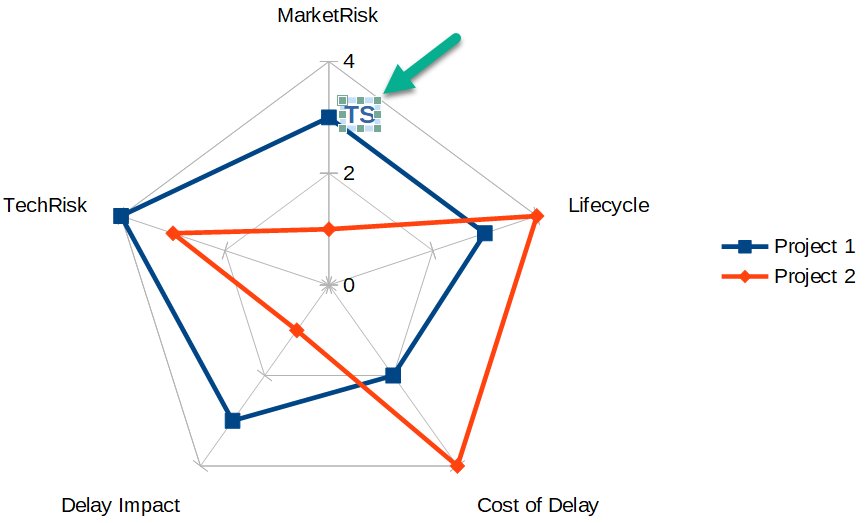
I was able to create this, already quite useful, but I have some problems with it:

  1. How can I put some text labels along
    the axis?
  2. How can I make sure that
    all axis are scaled to 4 even if my
    data doesn’t reach 4 with any of
    them?

Thanks!

From the menu, choose Insert>Text Box. Draw a text box and write in it. Customize the text box, font, size, etc. Position the text box on the chart. It looks like this:

To “2.” i have no idea yet.

So there is no way to have the chart automatically replace numbers with text?
Or to tell the chart what each text value actually means numerically, for example?
Adding Text labels by hand feels a bit of a workaround… :slight_smile:

I do not know any solution, which does not mean anything. Maybe someone else can help you.

No worries, and thanks in any case for the tip. Definitely better than nothing! :slight_smile:

If you’ve formatted a text box, you can also copy it, so you do not have to do the formatting steps each time.