Time data help?

I am currently working on a project where I obtained multiple data from the same source, but the data are in separate .csv files because the data is separated by time. I have a start time that is in standard hh:mm:ss.millisecond and then I have data that represents the time after the start time (in seconds) but as a purely numerical value. What I am wondering is if it is possible to add the value of the start time to the data that represents the seconds after start time?

file is here:link text

oweng, thank you. I knew it was something simple that I was overlooking. I am actually writing a computer program that will open this file and extract the data but I was having trouble setting the data up properly.

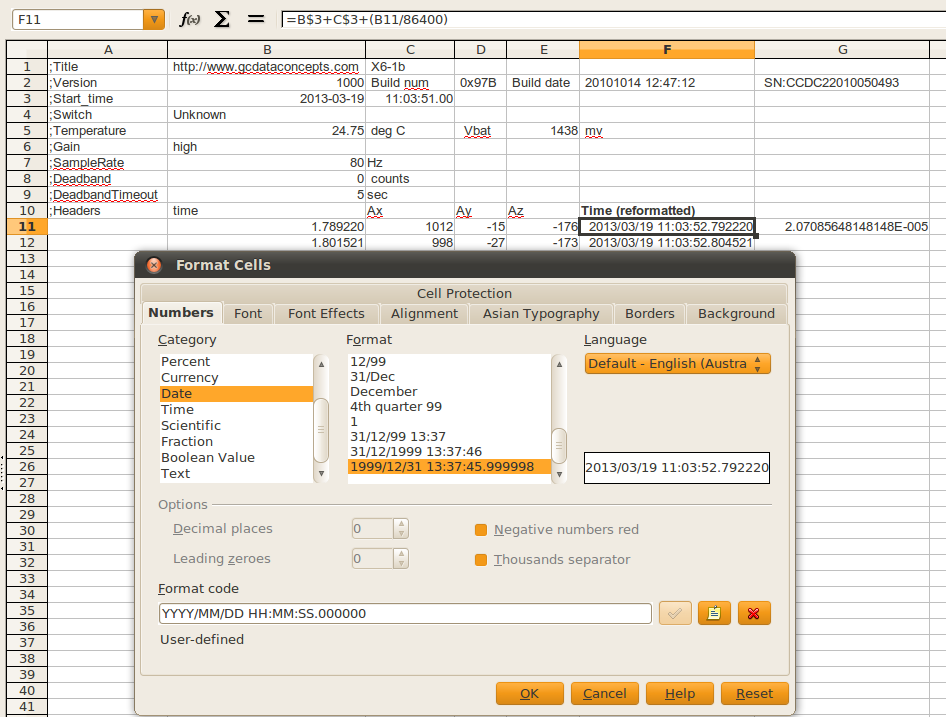
You cannot hold this as datetime value, which can deal only with full seconds. Your logger seems to read 8 sets of values every second and in this case you would still need another column to keep the fraction of the second. And this is pretty much what you have right now.

But considering the amount of data (72k lines) I am not really sure if Calc is the right tool for the task unless you reduce the amount of data by e.g using averages over several seconds or so. You most likely want to visualize it somehow and it is impossible to get a diagram from a set of 72k values, Calc will freeze during this (it might eventually finish it, but then you probably will need to adjust your diagram).

So, considering all this, you are better off with python scripts and pyplot (or whatever you fancy) if you need visualization. Google will be your guide. Or if you ask nicely I can donate my scripts which I wrote two years ago for slightly similar purpose (temperature and humidity logging over almost a year).

Oh, just to clarify, the point separates decimal places, so 6 digits make these not milli- but microseconds.
1.789220 would be 1 second and 789220 microseconds.

In basic terms, converting a numerical/decimal value representing seconds to a date/time format that Calc can understand requires dividing it by the number of seconds in a day (86400) as a day in Calc is stored as 1.0. Here is an example, using your data:

  • Date of test commencement 2013-03-19 (in cell B3)
  • Time of test commencement 11:03:51.00 (in C3)
  • Initial time data point 1.78922 (in B11)

Formula is =B$3+C$3+(B11/86400). Format the cell as YYYY/MM/DD HH:MM:SS.000000 and you will obtain what you require (display of 2013/03/19 11:03:52.792220). If you simply divide an initial time data point (e.g., 1.78922) by 86400 and set the cell format to Number/General you will see a more recognisable scientific notation value of 2.07085648148148E-05. Example screenshot here.

As @mahfiaz mentions pulling this amount of data (~70 data points per second) into Calc will stress it. 72k rows for 15 minutes of data will fill up a sheet in around 3.5 hours. While it always good to stress test LO, there are other solutions if you have a lot of data.