
For instance, I can put a name in quotations to define it inside the chart and not in the sheet anywhere:
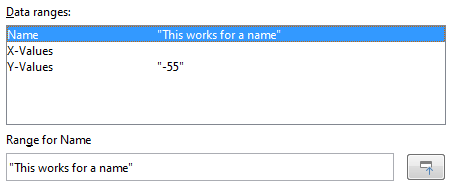
But is there a syntax that will allow me to hardcode a few numbers in the X-Values / Y-Values fields, to make a plot (like annotation lines on the graph) with numbers that aren’t in the sheet? ("-55" as shown doesn’t work.)