Hello, I’m looking for advices on how to format the chart in CALC. I want to make more space between the bars in the graph. I can’t find an option to do that. Additional detail: I am working on pivot chart.
Could you help me?
Thank you in advance 

Hello, I’m looking for advices on how to format the chart in CALC. I want to make more space between the bars in the graph. I can’t find an option to do that. Additional detail: I am working on pivot chart.
Could you help me?
Thank you in advance
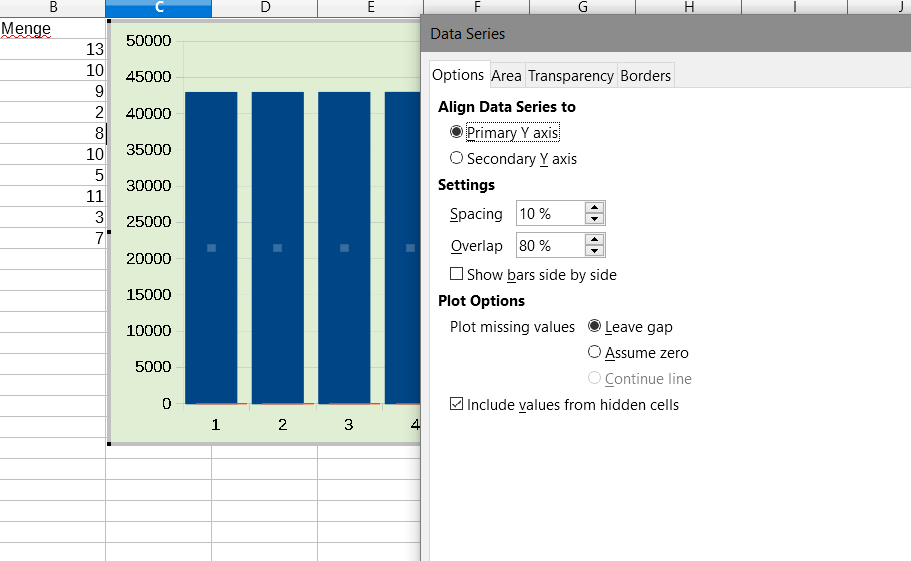
Editing the chart, right-click on a bar, select Format data series, play with Options - Settings
Edited 20190131
Edited 20190202
Pivot chart sample that works for me.
I did that (right-click on a bar and look through the settings). I didn’t find this option.
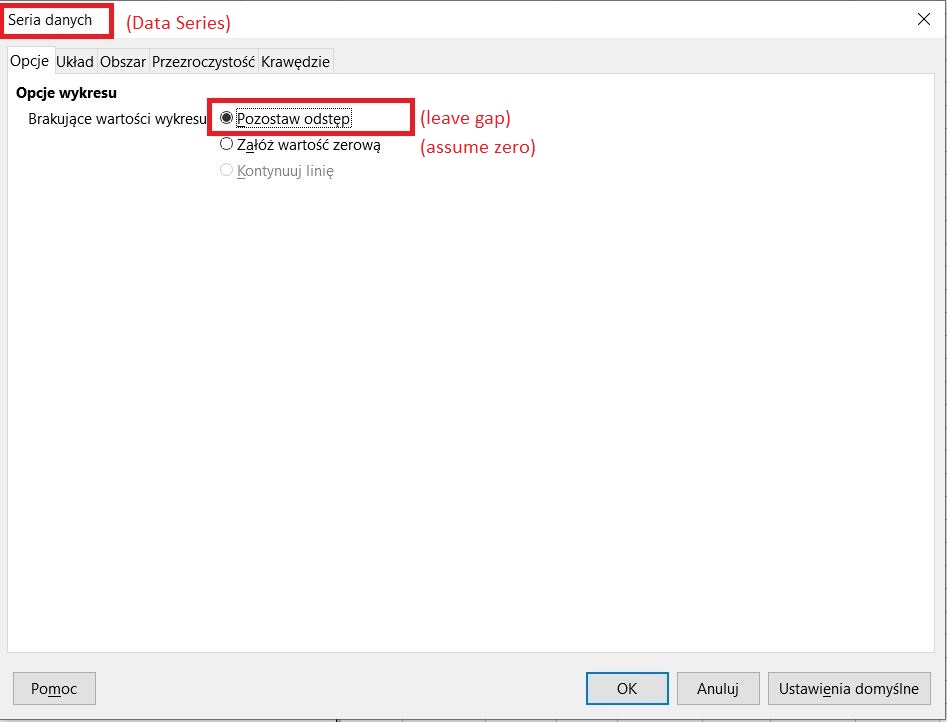
thanks however in my version of CALC there are no options like that, please look at above picture
What’s you LibreOffice version?
it’s LibreOffice 6.1.3.2
I have the very same menu with 6.1, please test with a new profile Menu/Help/Restart in Safe mode.
thanks, however for pivot charts still no change.
but thank you anyway