I want ask a question,
how to set intercept in chart = 0.
So my formula will be Y=Ax

I want ask a question,
how to set intercept in chart = 0.
So my formula will be Y=Ax
I made an example about how to plot lines in Calc. Please see the attached file: calc drawing lines.ods
If this doesn’t help you, then please clarify your question.
@fjr_29 - As your question is not very clear, this could also be your solution.
click on an axis and open the format axis window. The rest is to be seen from below image:
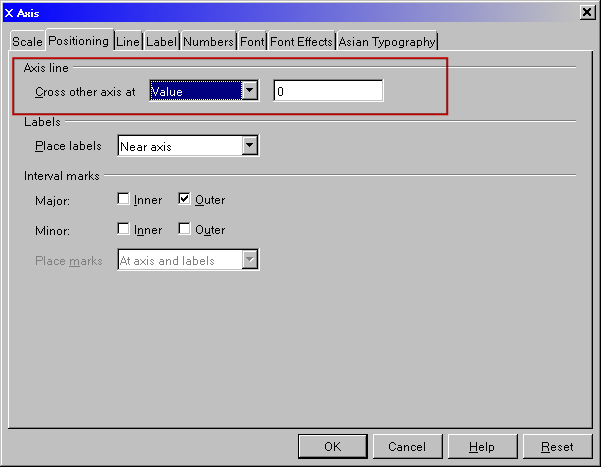
What I show you for the x-axis, you also can do for the y-axis.