I made a temperature graph, temp on Y and time on X-axis.
(It’s a scatter graph)
I only see 12AM and 12PM marked on the X-axis, even though my data was for every half hour.
How to make the X-axis show labels for all the hours ?
thanks

I made a temperature graph, temp on Y and time on X-axis.
(It’s a scatter graph)
I only see 12AM and 12PM marked on the X-axis, even though my data was for every half hour.
How to make the X-axis show labels for all the hours ?
thanks
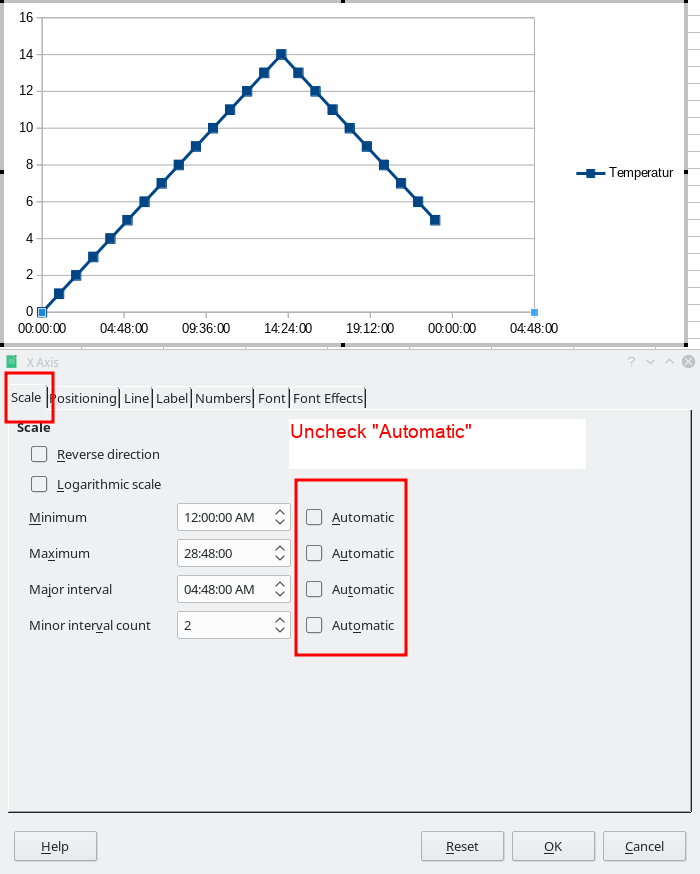
Double click on the X-axis and change the Scale tab from automatic to fit your needs. See example screenshot (This is just a demonstration of how it works and not a solution for your special case).
Opaque, thanks that worked.
Solved
Please do me a favor and mark the answer as correct by clicking the grey hook (which will turn to green then) and LO QA will get at least a few correct answers reported. Addtitionally other users could quickly see, if a question has a working solution. Thanks in advance.