
In other Process Mapping software “lanes” are created wherein all activities of a position are recorded. I cant find help on this topic and I cant find the tool to create the swim lanes, can you help please?
Draw them either with the line tool or with the table tool. Once done, group the composing objects and send them in the background (or an independent layer). Then draw the flowchart as a set of connected “boxes” and move them over the appropriate lanes. The connectors will be automatically rearranged to keep the boxes connected.
You can do as @ajlittoz said; use Draw to make a nice background - then you can save it as a template.
But there’s another quick-n-dirty way: Use Calc to make those cells.
Here is a screenshot from Draw:
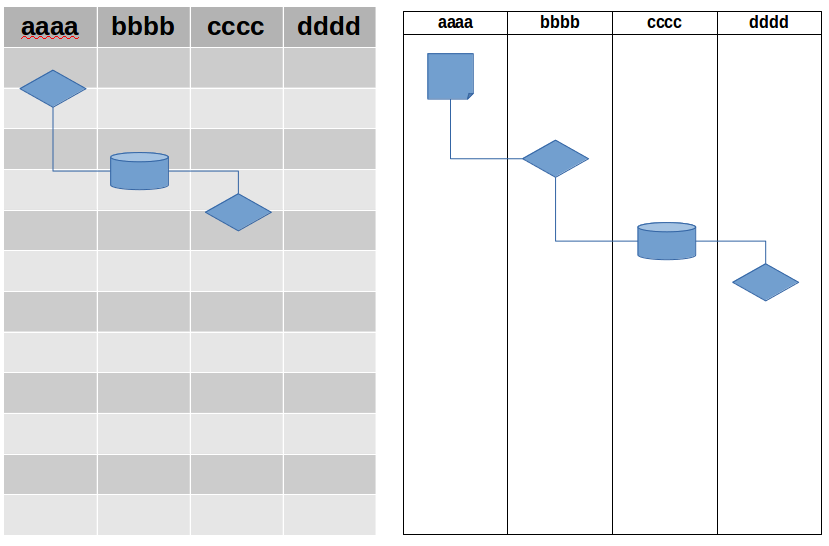
To the left I made several rows in 4 columns with headers, put outlines on the cells similar to the image on the right. Then selected those cells → Copy → Paste into Draw. The formerly colorless cells become banded, they stay as an active table (you can write into them).
To the right, the same is pasted through Paste Special as a GDI - Graphics Device Interface metafile. It’s much less manipulable, you can’t even change the color of the lines, but it looks more like the original Calc cells.
Hope this helps,