
I have a line graph versus time, indexed by month. I want each month to be plotted on the vertical grid lines, not in between them. How do I do this?
I am not very familiar with line charts, so I have to ask – Can you ‘format the axis’ of your chart? If not, then I would suggest using the x-y (scatter) chart instead of a line chart.
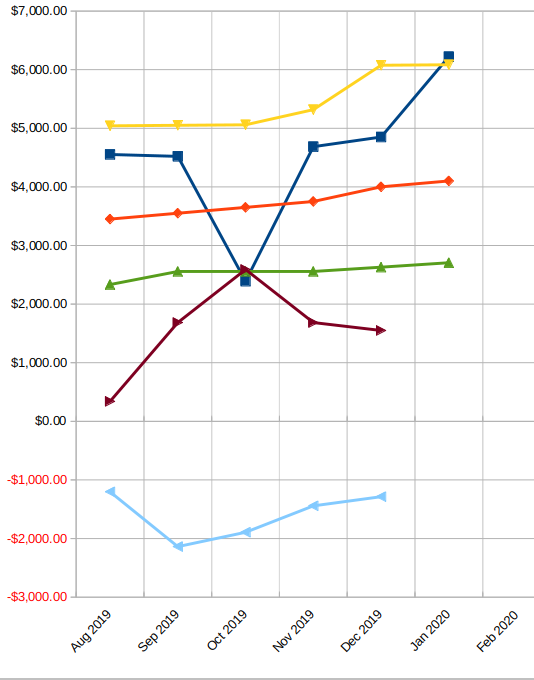
@ve3oat - format x-axis is possible with line charts and using Type Date in Tab:Scale of the format x-axis dialog allows to perform the requested alignment of the labels with the marks: But this also would align the data point to the grid.
An x-y scatter in general is no way to go, if “month” should be a category due to the fact, that length of months differ (31 days, 30 days and 28 days) and x-axis format cannot deal with that (very well).
See the following file: ChartLabelAlignment.ods
Due to the fact, that the solution in the file doesn’t keep the data points in the middle of the interval, I did not write a solution (besides the fact, that I don’t understand why a label indicatiing an interval [month] should be aligned to a specific date [first day of a month] given by the vertical grid line)
@anon73440385 - Thanks very much for your very informative comments. And your caution against using x-y (scatter) charts for this purpose is well taken, as I now recall having had a similar problem with them in the past.
@kvetter - it seems now that the suggested method by @anon73440385 should be a solution for you. Please let us know.
Format the dates as text.
- Copy the dates.
- Select the dates range and format it as text (
Ctrl+1, …). - Paste the dates as unformatted text (
Ctrl+Shift+Alt+V,Enter).
Tested with LibreOffice 6.4.7.2 (x86); OS: Windows 6.1.
Add Answer is reserved for solutions. If you think the answer is not satisfactory, add a comment below, or click edit (below your question) to add more information.
Check the mark (![]() →
→ ![]() ) to the left of the answer that solves your question.
) to the left of the answer that solves your question.