Please, the question is :
when is the usage (fuel spending) greater, when is it lower?
Many thanks!
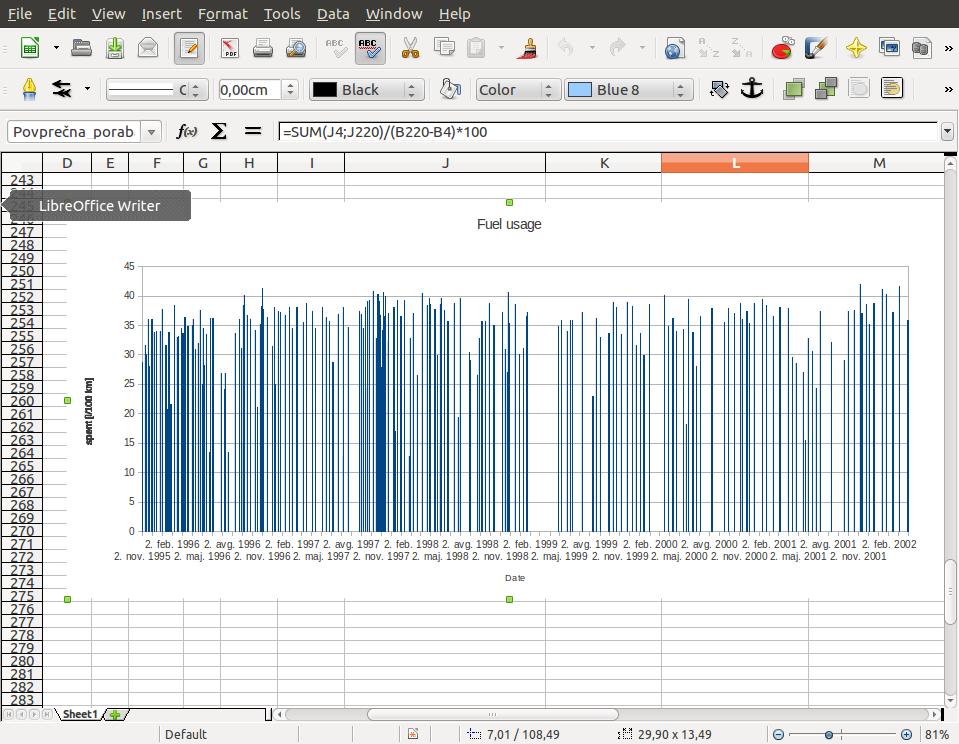
Do you mean which days have the highest and lowest values of spent [?/100 km] on the graph?

Do you mean which days have the highest and lowest values of spent [?/100 km] on the graph?