
Hi!
I want to turn some data into a stacked barchart, the data is details about activities done each day with a start and end time, and I want the barchart to have 1 bar per day, with the length of activities done for each segment. My test data currently looks like:
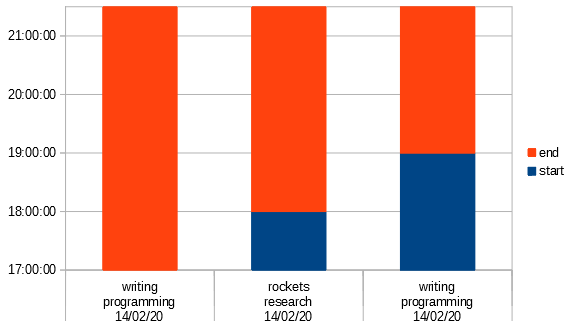
date	    activity	        sub	        start	    end
14/02/20	programming	        writing 	17:00:00	18:00:00
14/02/20	research	        rockets	    18:00:00	19:00:00
14/02/20	programming	        writing 	19:00:00	20:00:00
and comes out as
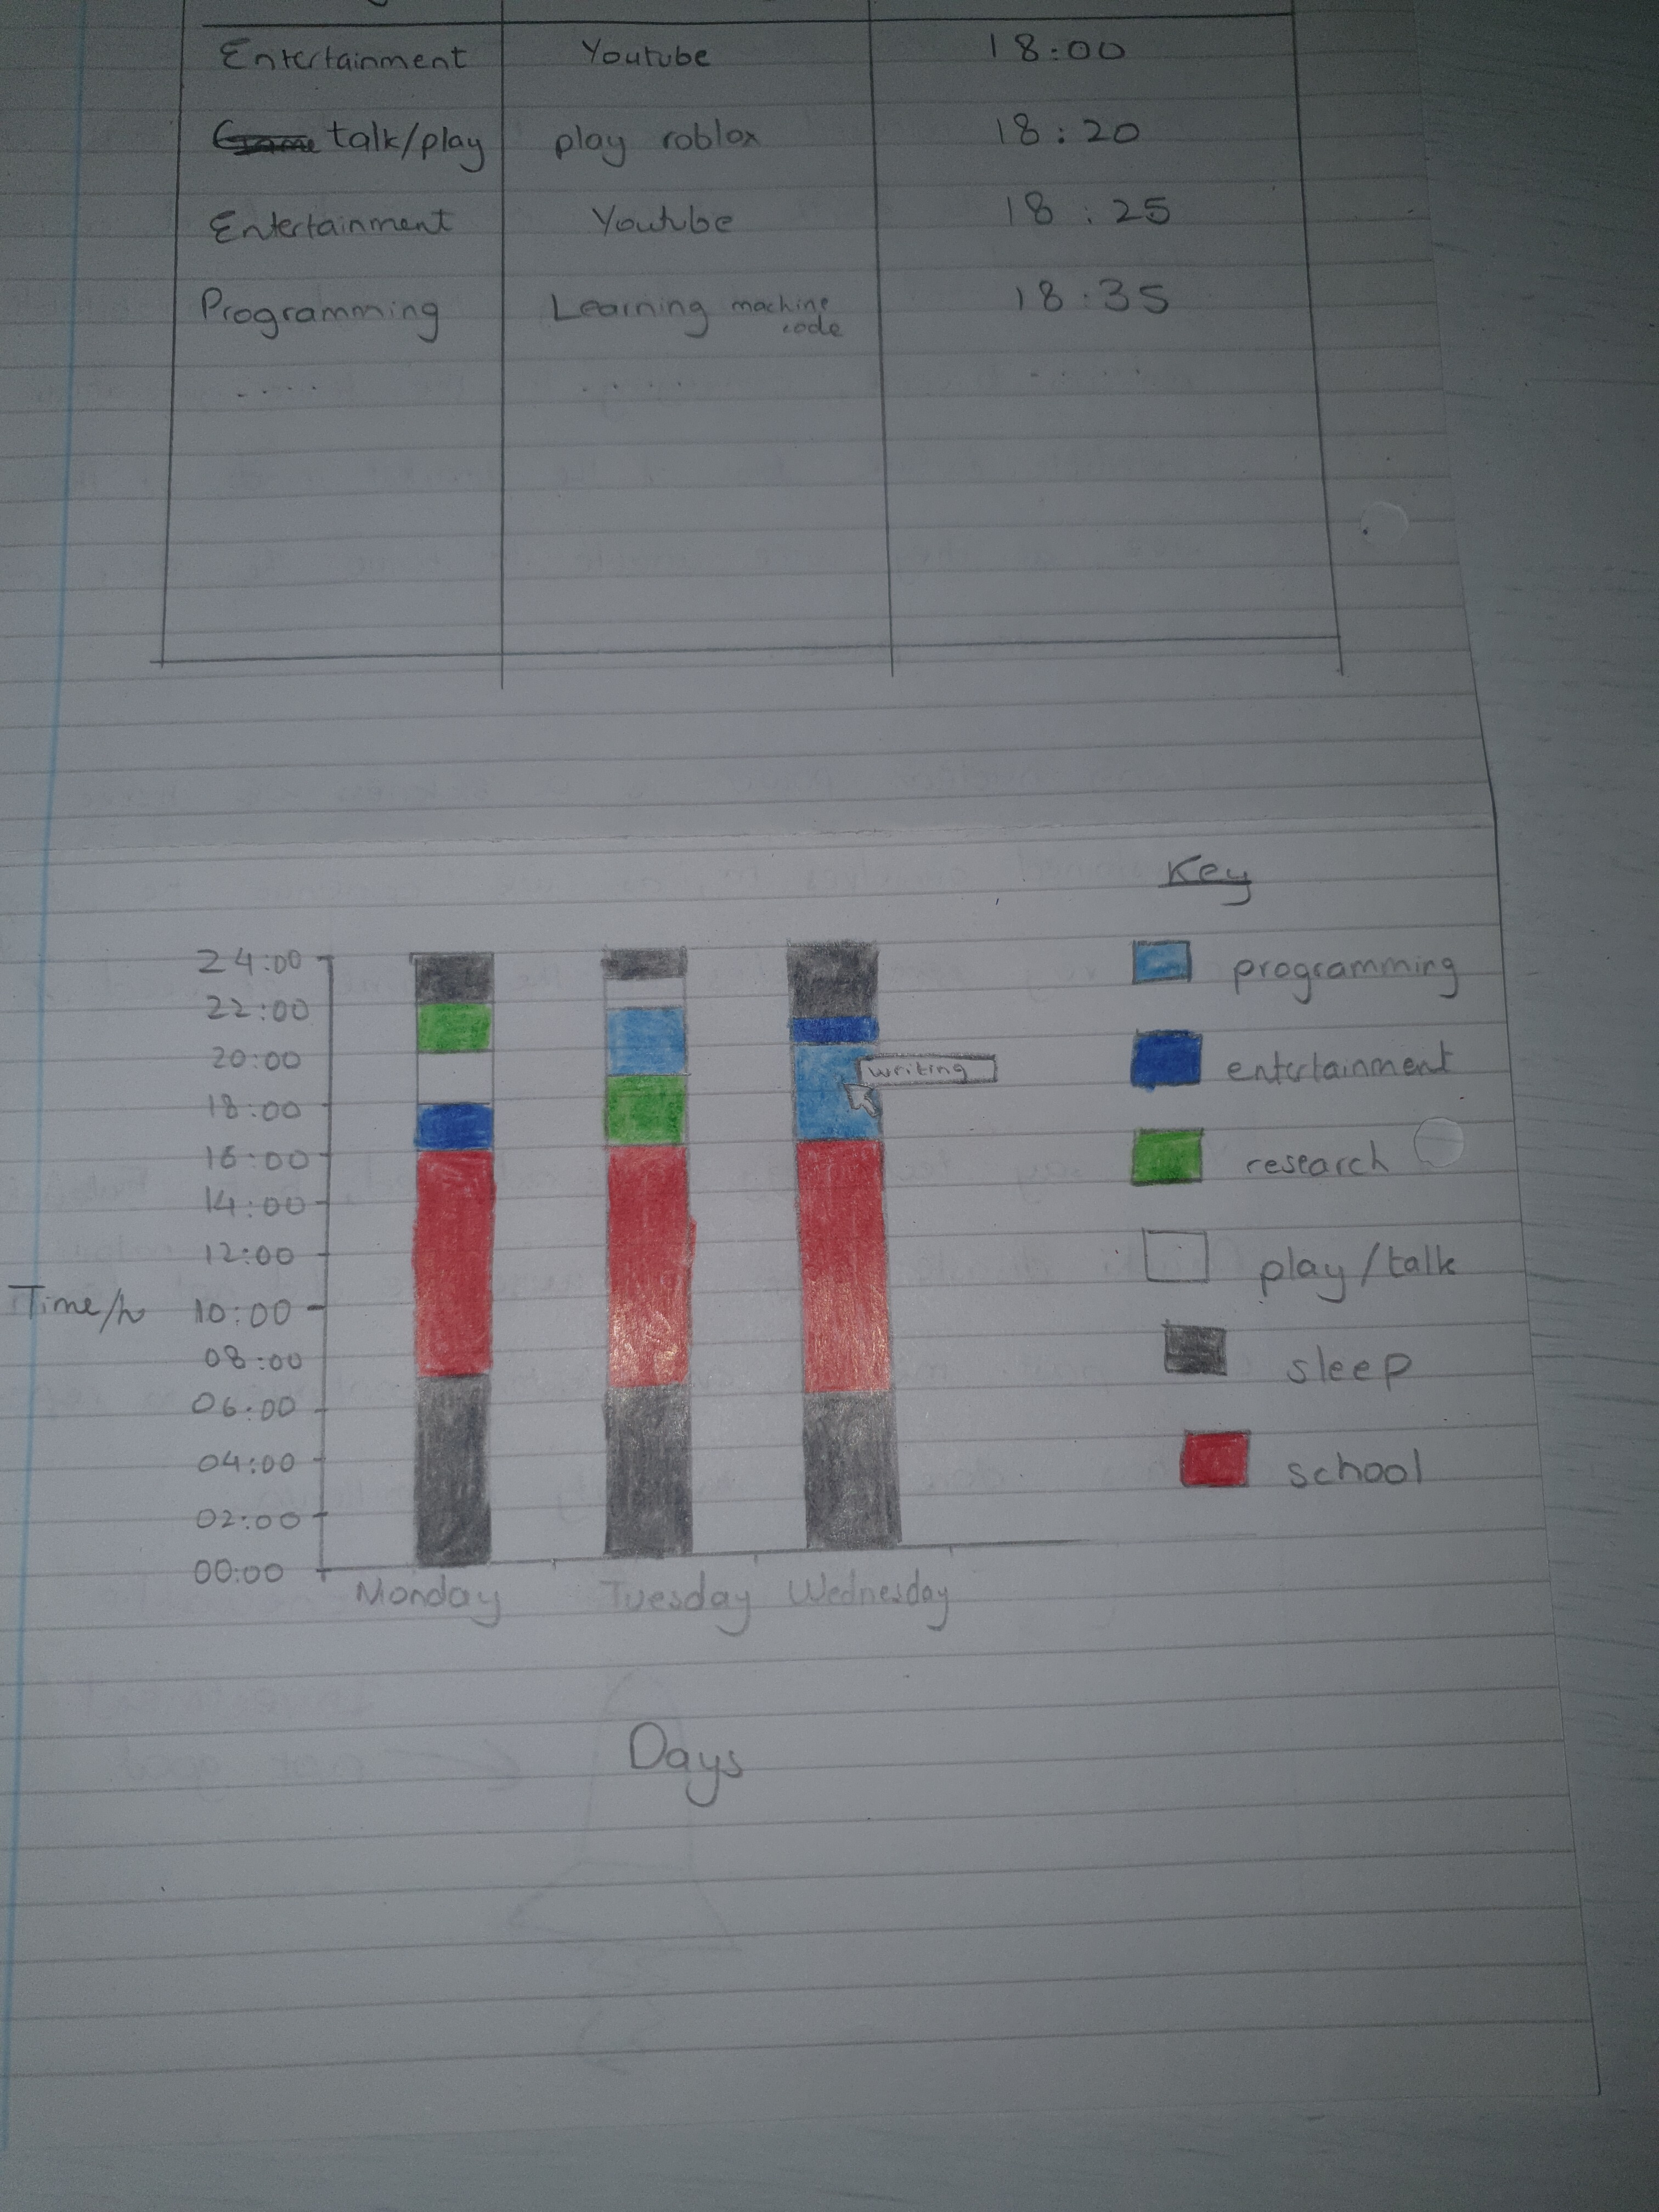
My intended chart should look like:
I would be very grateful for any help!