
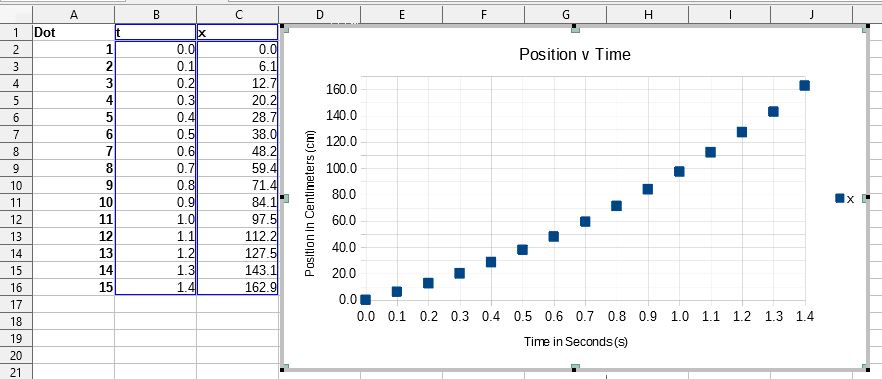
I am trying to make my Y-Axis go up by 10 from 0 to 170 but I can’t seem to figure out what to change to make it go up by 10 rather than 20. I changed the min to 0 and max to 170 and I tried messing around with the intervals but I can’t seem to make it go up by exactly 10 until it hits 170.
Graph.JPG
If you are using the X-Y scatter form of chart, it should be easy. Simply double-click on the chart to put it into Edit mode, then left-click on the y-axis to select it, right-click on the y-axis to get the little menu, choose Format Axis. There are many possibilities. Under the Numbers tab, be sure to unselect “source format”. Then the Scale tab is what you will want to use. Unselect all the “Autos” and then you have almost total control over how the axis will appear. (Sorry, read “y” for “x”.)
Hello
from a first look into the image - it is just your font, which doesn’t make the 10 unit to appear. Decrease the size of the font or increase the height of your chart. Check the following file:
Hope that helps.
If the answer helped to solve your problem, please click the check mark ( ) next to the answer.
Thank you for answering my question, but could you tell where do I go to increase the height of my chart?
Oh, I got it. I didn’t realize I just had to drag it down. Thanks for answering!