How do I create a 3D line graph from XYZ values?

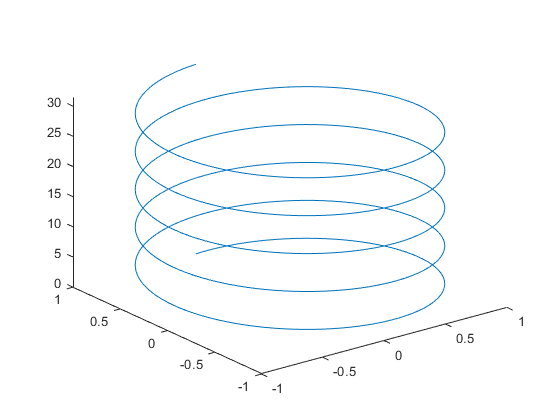
I’d like to depict XYZ triples in a 3D line graph, namely one Y value and one Z value per X value, respectively. This would look as follows (illustration from Matlab):

Bildbeschreibung

I presume this to be currently impossible. If yes, then I think this is a feature to support. If no: Is there any possibility to do that in the current Calc version?

AFAIK there is no easy way to do that in Calc.

Workaround: There are other tools out there which are capable of providing the desired output.

  • Matlab you mentioned. I don’t know this software first hand, but I suspect that it will take spreadsheet data as input.
  • Geogebra has a spreadsheet component and a friendly user interface.
  • R is a great tool for data manipulation, and it can also do 3d plots (may need a plugin, I faintly remember).

I have pasted active R objects into my documents. Not sure whether the other apps provide object service, but at least they will export the graph as a static image.