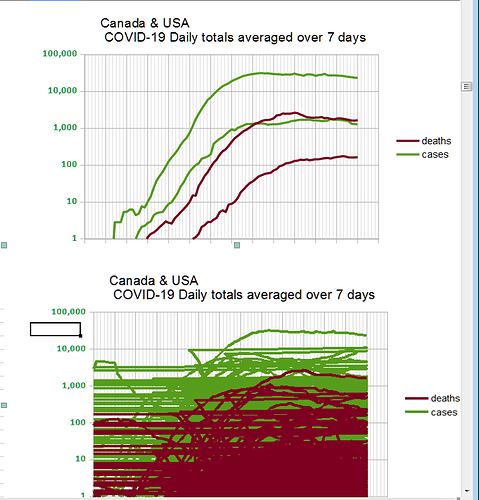
Why do charts not filter the data using Autofilter or Pivot Tables

Why do charts not filter the data using Autofilter or Pivot Tables
Only the export chart to graphic file works which is clumsy doing interactive filter charts. Excel worked.

When pasting the chart to BMP or PNG, it reveals all the hidden data filtered out.

Also, the Auto Recalc seems quirky on charts and often has to do a Hard Recalc.

There’s Pivot Chart…

There’s even help for it :wink:

And charts do respect filtered and hidden rows’ data, so maybe you are doing something different or it’s due to the data layout? Your second image looks odd… as if some Y values move backwards and then jump forward on the X axis.

1st chart, I inserted a dummy blank row to make charts non-contiguous for two data sets (countries in same column) 2nd I did not insert blank rows for all 170 countries so retrace garbage with all hidden data gets exposed on a graphic paste special BMP or PNG

It’s still not how I want it to look… but no options to choose same colour for category (country) AND line type (dot, line stripe) for dataset ( case , deaths ) since they come from only 2 sources and not 4.

OK The pivot chart works but not for dates. It takes the formatted X date column as a number. 1 to x and not even the date as its number format.

Insert image bugs here take 2… bad2.png

No solution on Autofilter paste special as BMP, so I’ll try pivot tables again, but above is NG.
After that, the Pivot format For Choosing top category needs work.