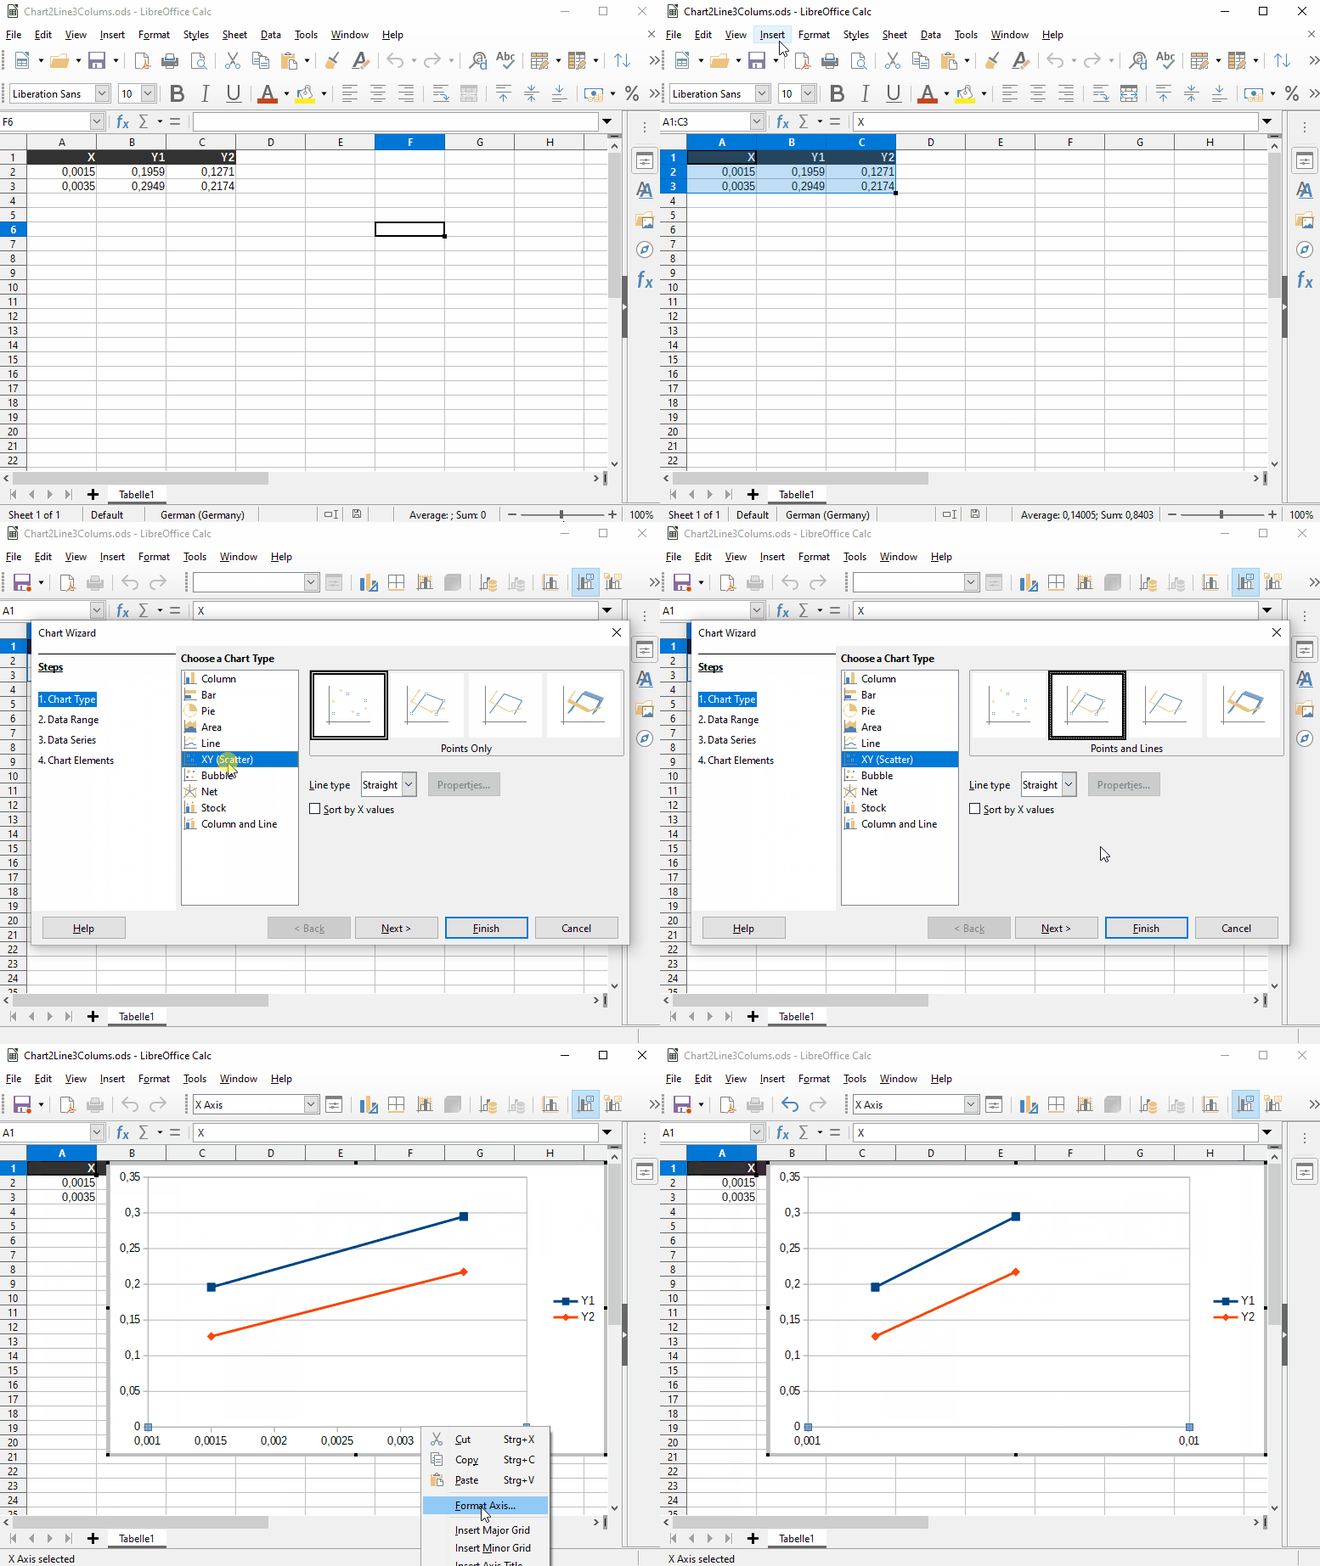
Suppose I have data (floats) in 3 columns such as this:
0.0015 0.1959 0.1271
0.0035 0.2949 0.2174
etc.
I would like to make a line plot where the first line will use the first column as the x-coordinate and the second column as the y-coordinate (so the points will be (0.0015,0.1959), (0.0035,0.2949), etc.) and the second line will use the first column as the x-coordinate and the third column as the y-coordinate (so the points will be (0.0015,0.1271), (0.0035,0.2174), etc.).
Also I’d like the x-axis to have a logarithmic scale.
How do I do this in LibreOffice Calc?
Thanks


 ) next to the answer.