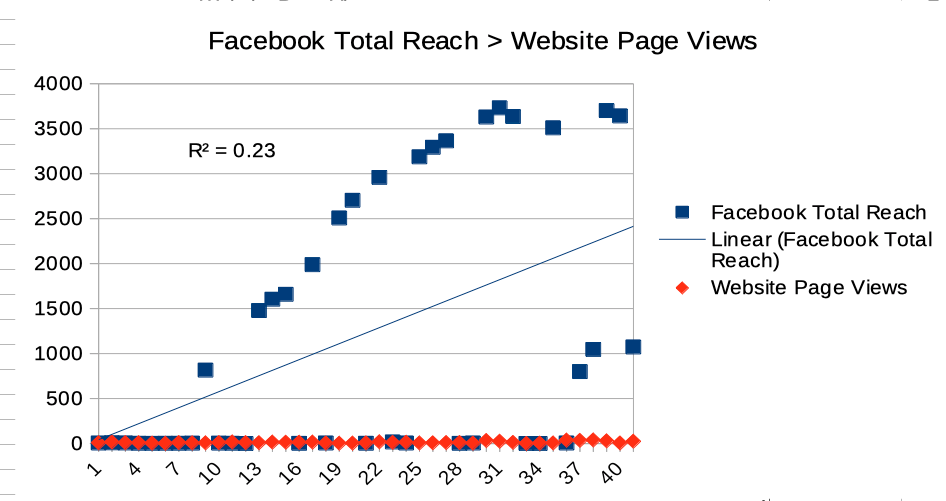
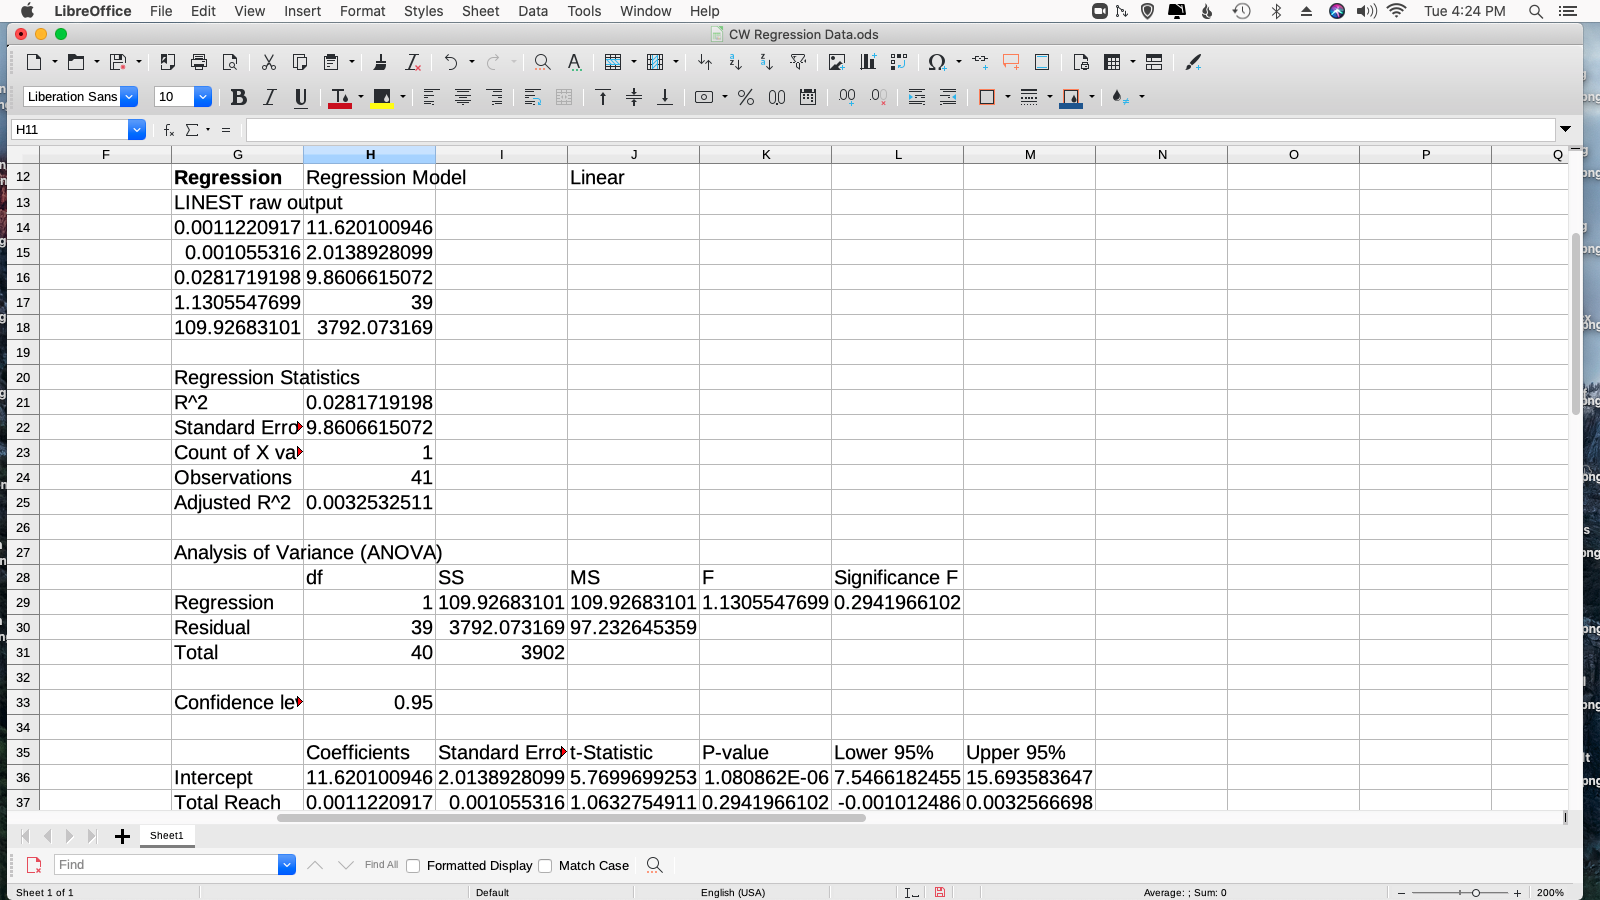
Two variables, an independent and a dependent. When I plot the data on a chart in calc and generate a trend line, R2 equals 0.23. Using the same data, when I perform linear regression, R2 equals .028. Why are they different?
Was the “linear regression” youi mentioned done by LINEST()?
How was the type parameter set? How was the respctive setting for the trendline?
- Yes.
- What do you mean by type parameter?
- I don’t know. This is what I did: https://www.youtube.com/watch?v=f4_GwWdUNqI
Using the formula wizard for LINEST you find “Linear type” as description for the third parameter.
Putting there 0 or something else tells the algorithm whether or not the linear trendline needs tp pass through the origin of the coordinate system.
Origin not forced for either chart or regression. I can’f figure out how to attach files here. You can find the two items here:


I cared for the needed “karma”. Editing your original question you should now find a “paperclip-tool” which will help you to attach files.
(I’m too old to understand these boring U-to-be things.)
Please have a glance into the attached example:
ask247766simpleChartWithTwoTrendlinesComparingR_squared_1.ods
Did not answer my question.
If there isn’t a basical misunderstanding beyond my horizon:
I cannot answer your question without an example of a Sheet with a Chart and a working LINEST() formula showing the issue.
Did you study my example?
Did you read my comment on your question concerning how to attach an example file?
