
Your screenshot is useless, if you don’t explain what you expect to see, which data ranges you have selected and which chart type you used (Damn is not a sufficient explanation of your goal)
Please, take a look at LibreOffice Help on Chart Wizard.
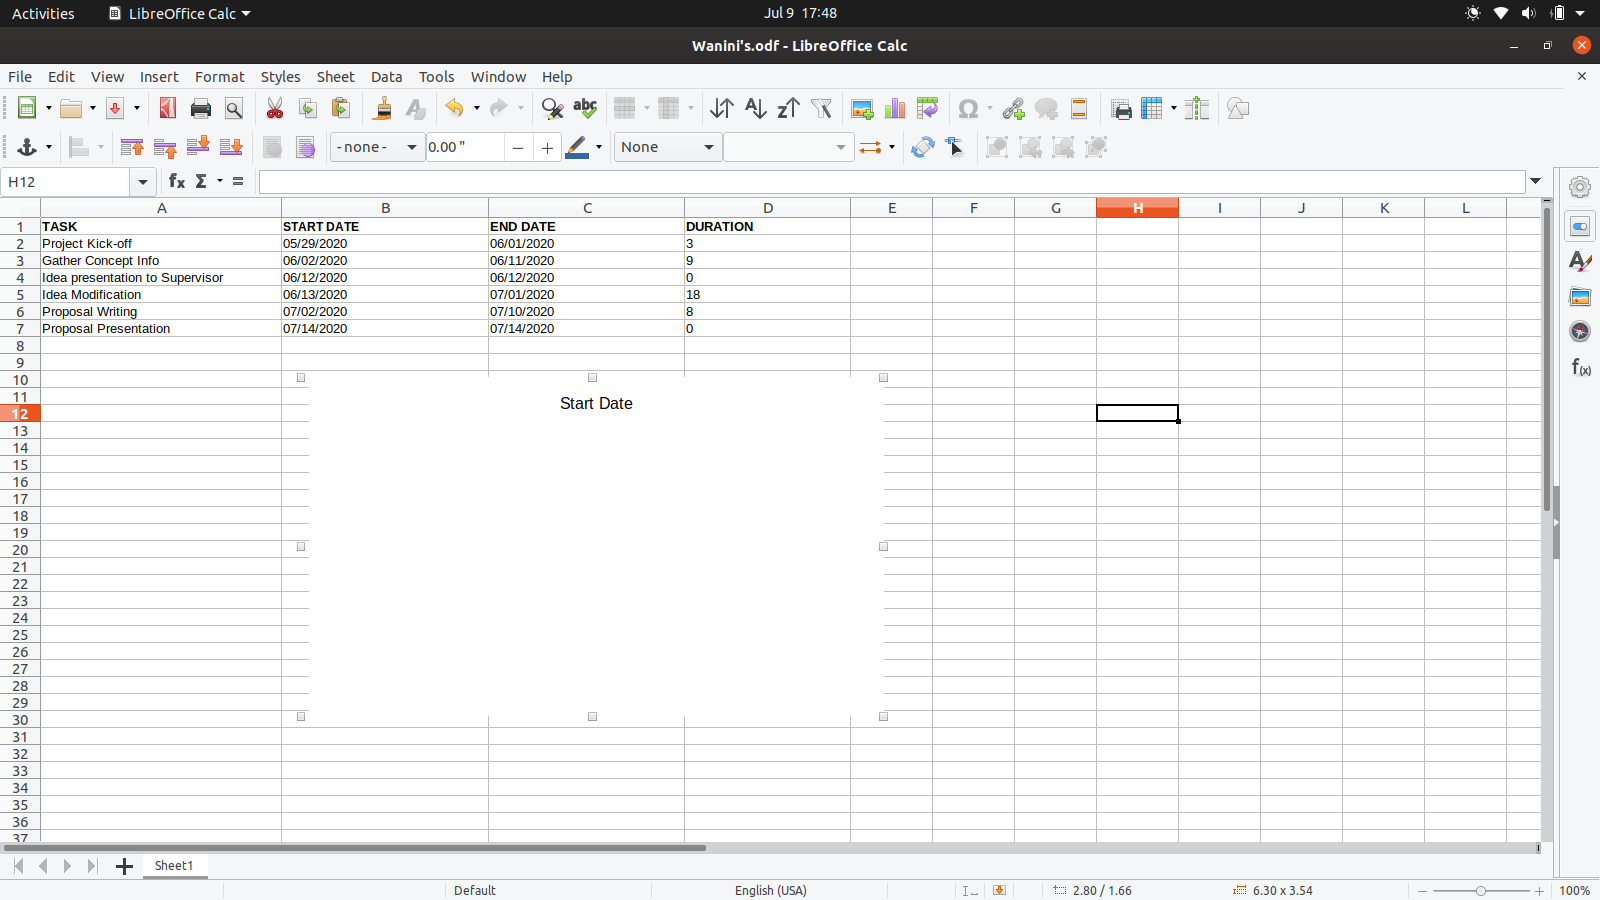
It seems to me that you need to select A1:A7 and D1:D7, then choose menu Insert - Chart… and follow the steps explained there.
Probably you will need to add 1 to each duration; a task completed in the same day has no duration of 0.
Edit your question to add more information: chart type, and data to be displayed.
Do not use Add Answer to comment.
Sorry, I removed the notation in the question which is you reference → D—. I agree but feel more strongly. It doesn’t belong at all.