Where is the "data series" edit option hidden now?

I have an XY scatter chart - X axis is a date with some dates missing, Y is a number for each date, Y is 0 for missing dates in X:

Screenshot_20201028_180718.png

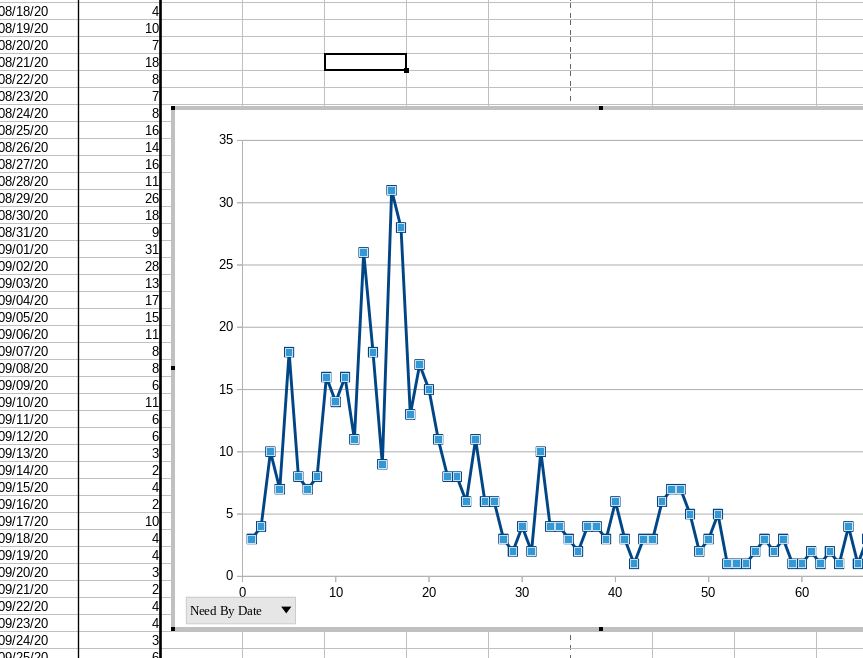
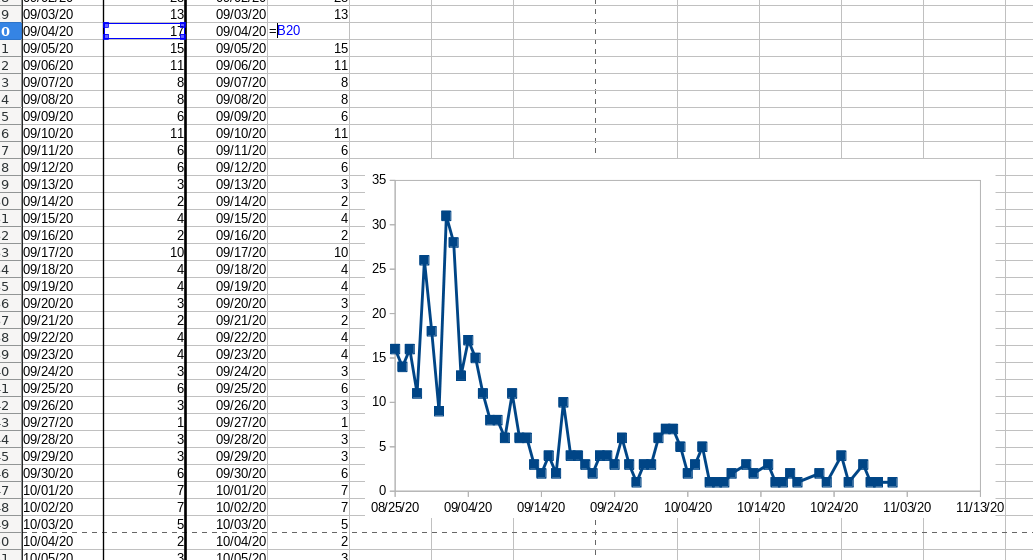
As you can see from the picture, the X axis is labeled with the ordinal number of the cell in the X-column, and I want it to be the date. There used to be an option to edit the data series to use the X values as data in a XY scatter chart - I can’t find it. In the Menus or by clicking on the data series. Has this option moved or gone away?

Possibly relevant: The X and Y data is in a pivot table.

w

ANSWER:

The data being in a pivot table is relevant. To create a scatter chart with values in the X axis from a pivot table, you need to make a copy of the pivot table is some “plain” cells. This will get you the “normal” set of options when you right-click on the data series in the graph, with “Data Ranges…” at the bottom. If the data is derived from a pivot table, the “Data Ranges…” option will not be present.

Screenshot_20201028_182819.png

As I’ve invested quite a few hours troubleshooting the same problem, I’m happy to have found a workaround that doesn’t require manually copying the pivot table every time it updates. See https://ask.libreoffice.org/t/simple-workaround-to-bypass-flaws-of-xy-pivot-charts/ .