Pivot rows to columns for a stacked bar chart

I’ve got a Calc table with workout logs like this:

Date	  Week	Distance (km)
31/10/20	44	42.22
29/10/20	44	10.05
25/10/20	43	30.10
24/10/20	43	14.14
20/10/20	43	10.47
17/10/20	42	27.16
15/10/20	42	18.51

I would like to convert it to a list of workouts per week, as a intermediate step for creating a stacked-column chart. This is what I want to end up with:

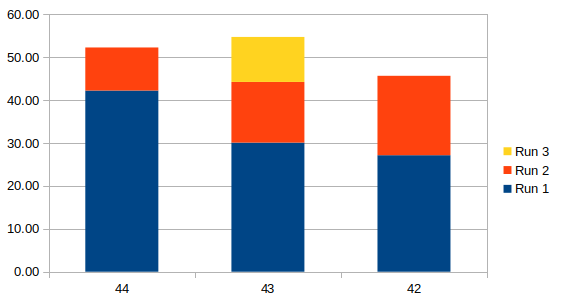
Week   Run 1   Run 2   Run 3
44     42.22   10.05	
43     30.10   14.14   10.47
42     27.16   18.51	

Sometimes I’ve got up to 4 or 5 runs per week, sometimes none when I was lazy.

How can I do this in Calc?

EDIT: Ultimately I want to create a chart like this from the workout log:

image description

I was hoping for a pivot-table based
solution

Ok, but only with an additional column in the source table.

Pivot.ods

Good work!

An option with IF formulas and AutoFilter:

  1. Copy the formulas on range D2:H2 from the sample file
  2. Paste down until the last row with data
  3. Select from Date (A1) to H last row
  4. Choose menu Data - AutoFilter
  5. Press the header in H1, and unselect FALSE
  6. Select from “Week” (B1) until G last row
  7. Choose menu Insert - Chart… (it seems you already know the rest of the way)
  8. To recover your data structure: choose menu Data - AutoFilter (the chart will be scrambled)

See sample file.

A second option; it is not what you are looking for, but it is simpler (you will get one data for each week):

  1. Click on a cell with empty cells below and to the right (in the sample file: J1)
  2. Choose menu Data - Consolidate…
  3. In Function field select Sum
  4. Select your data from “Week” to last row under “Distance (km)” (maybe you need to press the Shrink button below Source data ranges:)
  5. Press the Add button
  6. Click on Options and check Row labels and Column labels
  7. OK

Tested with LibreOffice 6.4.7.2 (x86); OS: Windows 6.1.


Add Answer is reserved for solutions.

Press edit below your question if you want to add more information; also can comment an answer.

Check the mark (Answer markCorrect answer mark) to the left of the answer that solves your question.

I had forgotten to attach the sample file. It is done.

Thanks for that. I was hoping for a pivot-table based solution (more generic) but the first option you propose is quite creative, may be ok for my needs. Thanks!